The APHIS National Honey Bee Survey (NHBS) is a comprehensive physical examination of apiaries throughout the United Stated. The NHBS began in 2009 in order to address rising concerns over the health and sustainability of honey bee populations. The NHBS was funded by USDA-APHIS and is a collaboration between the University of Maryland and the USDA-ARS Bee Research Laboratory. The purpose of the NHBS is to be a comprehensive analysis of honey bee pests and an examination of the health of apiaries to further provide context for future and present epidemiological studies. One aspect of the NHBS is that each sample is tested for the Varroa mite and the fungal spore Nosema. The analysis of these two pathogens are measured for their presence and prevalence from a composite sample of 8 hives in an apiary. Pesticide analysis is another aspect of the NHBS that contributes a large role in the project. In 2013 174 known pesticides were tested from samples across 34 states (Rennich et el., 2013). An additional aspect of the NHBS is that it confirms the presence or absence of specific exotic honeybee pathogens. The survey tests for the presence of the parasitic mite Tropilaelaps clareae, Slow Bee Paralysis Virus and the Asiatic honey bee Apis cerana.
As part of the NHBS a census of known honey bee viruses is conducted to investigate their incidence and abundance. The honey bee viruses that are investigated are Slow Bee Paralysis Virus, Kashmir Bee Virus, Acute Bee Paralysis Virus, Israeli Acute Paralysis Virus, Deformed Wing Virus, Chronic Bee Paralysis Virus, Black Queen Cell Virus (2009-2013) and Lake Sinai Virus (2013-2014). The molecular quantification of the viruses using RT-qPCR techniques is where I come into the picture and is a place where would like to greater elucidate the methodologies of viral detection.
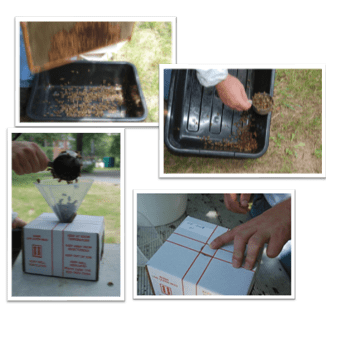
In order to obtain a sample that can be analyzed field technicians are deployed to apiaries across the United States to collect honeybee samples to be shipped back in live bee boxes to the USDA-ARS Bee Research Laboratory. The techniques used to collect live bee samples are outlined in the picture below (figure 1).
Upon arrival the samples are then stored in -80°C freezer for future processing. The reason that a live sample is collected as opposed to an alcohol sample is to conserve the integrity of the DNA and RNA. After a honey bee or any organism dies, biological processes soon begin that cause the breakdown of nucleic acids and other biological molecules. By collecting live bees and freezing them upon arrival we are able ensure high levels of nucleic acid quality and are able to standardize the quality of the viral genetic material
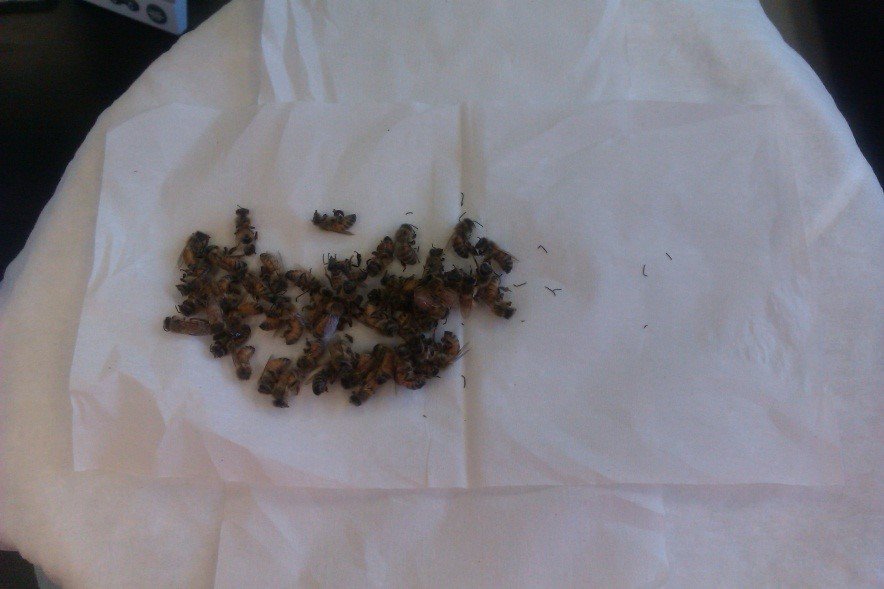
When the process of RNA extraction for viral detection begins, the first step is to count out 50 bees from the sample and transfer them into an extraction bag. This is done over ice so that the sample does not thaw and the integrity of the RNA is insured (figure 2). Following this step is the homogenization of the honey bee tissue in a Guanidine Thiocyanate based buffer mediated through liquid nitrogen.
Conducting this step of the protocol was the first time while working in lab that I began to feel like a scientist. This came from the numerous elementary school science assemblies when a group would be invited down to showcase experiments. During these presentations there would always be an experiment when they would display the use of liquid nitrogen and I remember it very well.
It would begin with a scientist bouncing a tennis ball up-and-down to show that this is not a trick tennis ball. Next, the canister would be opened followed by the tennis ball being lowered into the “mysterious” smoking substance. After a couple of minutes the ball would then be retrieved with smoke billowing around the object. The scientist would then return to bouncing the ball only this time it would not return faithfully to her hand. This time the ball would undergo a “metamorphosis” and transform into a thousand tiny pieces as it spread across the gym floor. To a child this was magic.
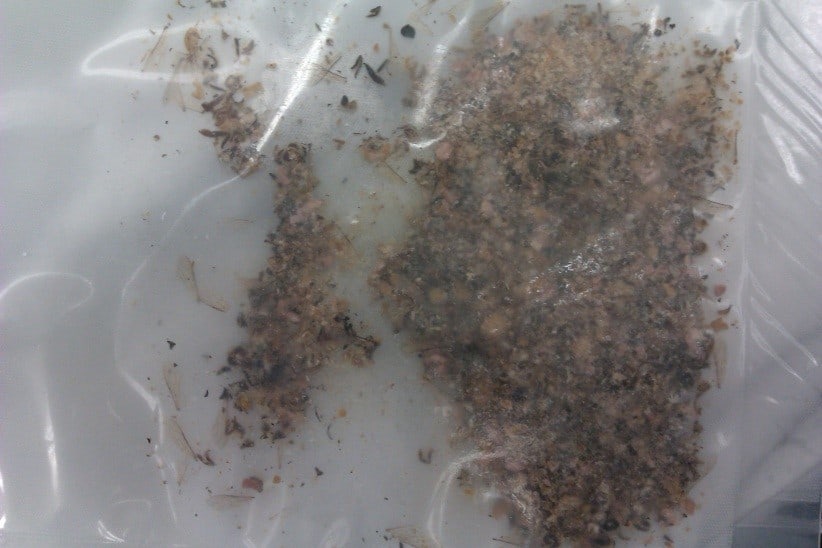
But I digress. Getting back to the extraction protocols, after counting out a sample of 50 bees and placing them into an extraction bag, we lower the sample into the liquid nitrogen to flash freeze them. Then, using a pestle and a marble slab, the sample is ground and homogenized into a powdery form (Figure 3). Then, the Guanidine Thiocyanate based buffer is added to suspend the sample in a liquid medium and to preserve the integrity of the RNA. Finally, 1 mL of the sample is pipetted into a tube to obtain the crude extraction which is used further down the pipeline for RNA extractions and other molecular work. In my next blog post I will continue the explanation of how we obtain our viral data.
Rennich, K. (2013). 2012‐2013 National Honey Bee Pests and Diseases Survey Report. 1-23. Retrieved November 10, 2014, from https://beeinformed.org/wp-content/uploads/2014/10/2012-13-End-of-year-final-report.pdf
USDA Honey Bee Pests and Diseases Survey Project Plan for 2014. (2014). 1-6. Retrieved November 10, 2014, from http://www.aphis.usda.gov/plant_health/plant_pest_info/ honey_bees/downloads/SurveyProjectPlan.pdf