May showers bring June flowers…and the BIP National Loss Survey results
The month of May always heralds the release of preliminary results from our BIP National Loss survey. But before we get into the results and what those mean, May Tech Team sampling resulted in averages of Nosema and Varroa loads across all tech teams at 0.75 million spores/bee and 0.55 mites/100 bees respectively.
Our preliminary loss report was posted on May 10th with more than 5,700 beekeepers responding. Colony losses in 2015-2016 inched up to an annual total loss of 44.1% with increases in both summer (28.1%) and winter (28.1%) total losses. You can read the full report at our website but we want to take this opportunity to explain the survey and the results. Before BIP started recording losses, there were no other numbers to compare what “normal” losses are for beekeepers and what is excessive. We are also trying to make the results more accessible every year by improving our website.
The Bee Informed Partnership reports total loss, or a weighted loss rate. Total loss treats each colony the same or more simply stated, “One colony one vote.” This means that the total loss rate is more representative of commercial beekeeper loss as they operate a large majority of the colonies in the survey. The average loss rate, which we no longer report in our preliminary summary, is an unweighted rate where we calculate the loss rate for each responding beekeeper and average these rates. So average loss, more simply stated is, “One beekeeper, one vote.” As there are many more backyard beekeepers than commercial beekeepers, average loss rates are more influenced by these smaller beekeepers.
Because the BIP winter loss results are presented as one number (28.1% total winter loss), it does not show the huge variability in what commercial beekeepers (and other operational sizes) report as their losses. Some beekeepers have losses well under 15% while others have over 50%. The 28.1% can be hard to relate to if you are on either end of the spectrum.
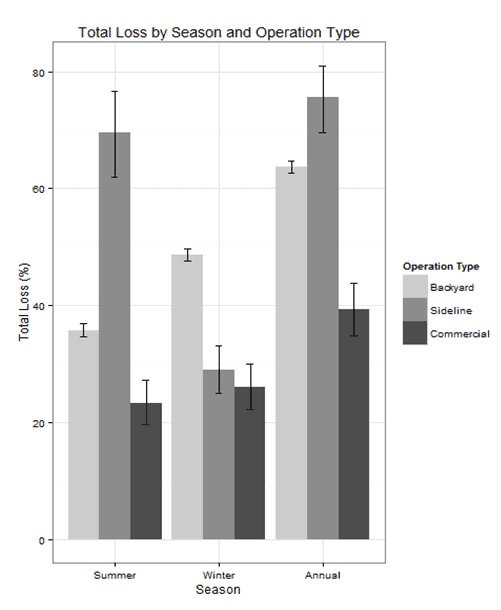
Consistently across all BIP survey years, commercial beekeepers reported having fewer winter and annual losses compared to backyard beekeepers. For this year, Figure 1 illustrates the variation of losses across operation types from the BIP survey.
Over the last year, and for the first time, the National Agricultural Statistical Survey (NASS) was funded to conduct a colony loss survey and the NASS report was released on May 12. The NASS results are presented as quarterly loss rates and so are not directly comparable to BIP numbers; however, we have reworked their numbers to permit some comparisons. NASS is able to track almost all commercial migratory operations so their total losses would be primarily driven by commercial beekeepers as are the BIP results.