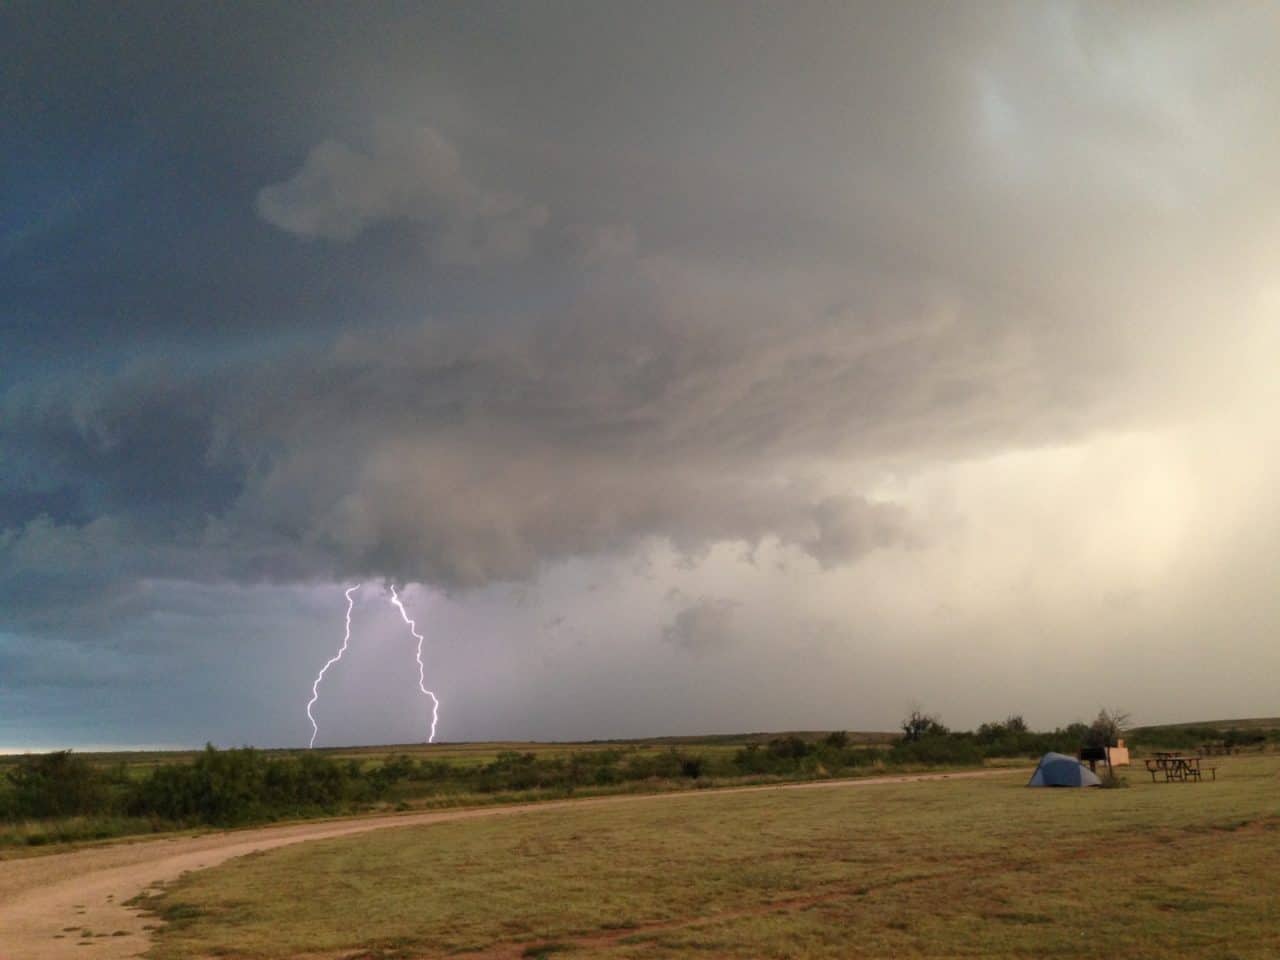
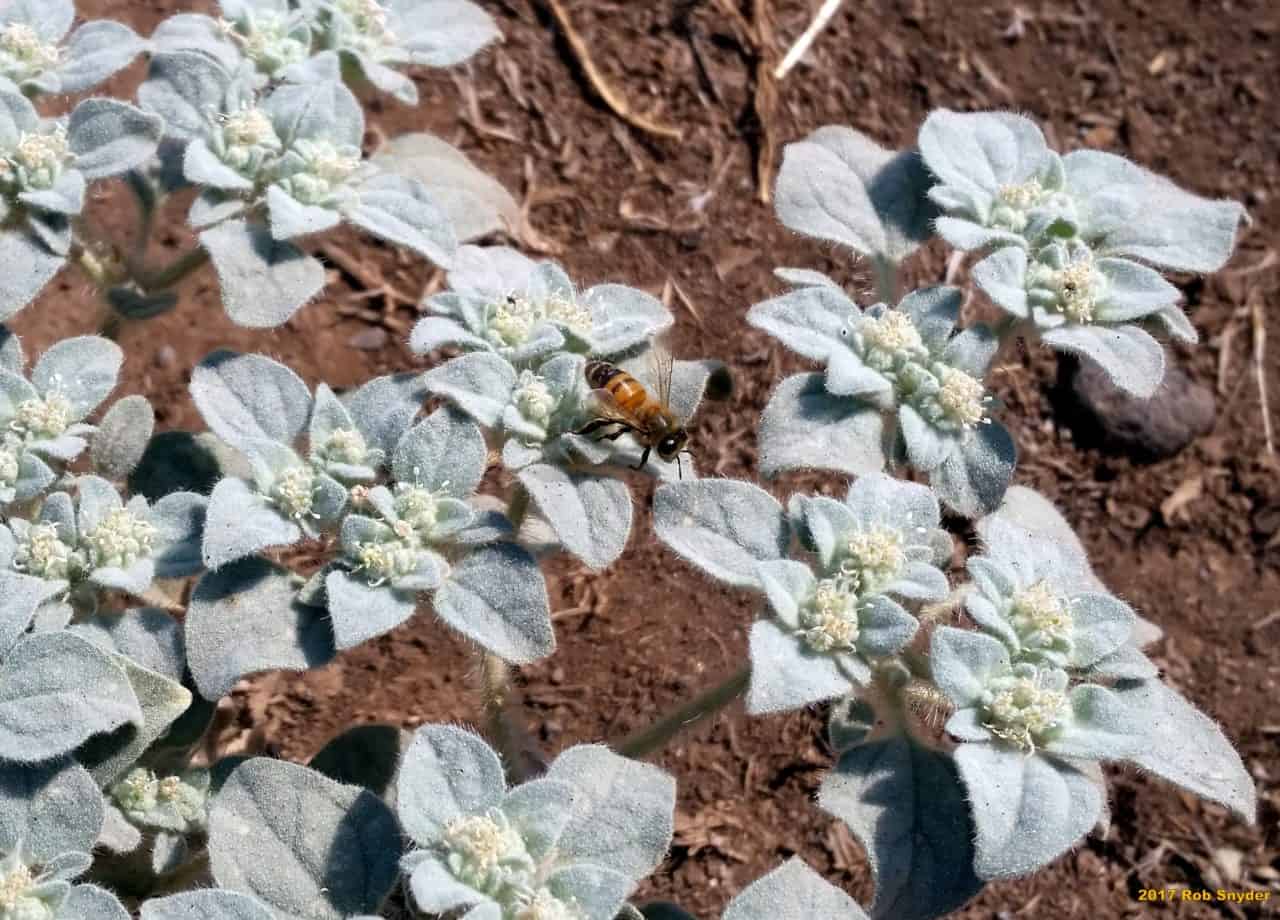
I have been working in Texas for the Bee Informed Partnership since May, 2017. Many US commercial honey bee colonies are part of migratory beekeeping operations, so I have been on the road a great deal of the last 5 months helping beekeepers monitor the health of their colonies. I have been in a lot of bee yards in the Dakotas this past summer, and I’ll be going to California when the hives are trucked there to pollinate the almond orchards in the spring. Some of the beekeepers I work with keep their bees in Texas all…
Category: Blog
The Bee Informed Blog is the place where team members convey their experience, knowledge, and opinions about their work with bees. Here is your opportunity to follow what’s happening in the field and lab.
Varroa Destructor Virus-1: It’s here…
This blog has been updated from the original blog posted on October 10, 2017. As of this date, December 12, 2017, the final paper describing the work below has been published and can by found in it's entirety at this link at Nature.com **************************** One of the best things about working in research is that it never fails to surprise – for good or for bad. And occasionally, it is not until much later that the surprise comes. In this case, the “surprise” arrived in the form of another Varroa-vectored, RNA virus, Varroa Destructor Virus-1, or VDV1. Our University of Maryland lab has been leading…
Migratory Pallets
Pallets: 4-way vs. 6-way The vast majority of colonies in commercial operations are on pallets to facilitate ease of movement with forklifts. There are many design components to be considered (clip style (U vs.W), open/closed centers, screened/closed floors, drainage holes which can be rectified with the french drain installation, entrance size and orientation, . . .) when building pallets but the first decision a beekeeper will likely make is how many colonies per pallet they want to run. I’ve seen pallets designed for 2,3,4,6 and 8 colonies but the vast majority are either built for 4 or 6 colonies. As…
Bee Informed Partnership Technical Transfer Teams…and family
In 2011 when the first Bee Informed Partnership technical transfer team was formed in northern California (really, even before that, but we won’t confuse the story), no one could have ever guessed where it would take us. We had long range plans but most were vague and foggy. There was so much to do right now. So many things to learn. So many details to iron out. So many miles to put on trucks and so many samples to collect and process. But here we are…6 years later. Older. Wiser. And now those long range plans are much clearer and the pesky details are getting…
How To Annotate Your BIP Hive Scale Data
Hopefully by now you all have your mites under control and are well on your way in preparing your hives for winter! If you are operating a hive scale and forwarding your data to the Bee Informed Partnership, as your beekeeping season begins to wind down and you have more time to spare, we'd strongly encourage you to login to the BIP hive scale portal and annotate your scale data. While many of the "BIP Ready" scales available to beekeepers today collect data well beyond hive weight, the weight of you colony is perhaps the most informative in understanding what is going on in the…
Comb Management: Part 1
Comb management is an important aspect of beekeeping, but comb management has not always been a management strategy of beekeepers. Rather, comb management is a fairly new concept. Beekeepers started managing comb with the invention of the Langstroth hive in the 1850’s. Today, comb management is a common practice for beekeepers, and an aspect of beekeeping beekeepers must be cognizant of. Because of the importance of comb management, I am writing 4-part blog-series on the subject. The blog-series is split into 4 parts: History of comb management Management strategies of foundation Cell size: why so much variation between producers? Benefits of replacing old comb I…
Mite-A-Thon has Begun!
Mite-A-Thon, the first ever national event to capture and collect Varroa mite infestations in North America has started! Please dust off your sugar shake jars, grab some powdered sugar and join us in the colonies starting today and lasting until September 16th (we hope you continue to monitor your colonies beyond this drive as MiteCheck.com is always open and your data is always welcome). Add your data to this map and make it light up! Look at the data and see what management practices are being used around the country. If you have questions about what management or treatment strategy you should use, please see…
Announcing Mite-A-Thon 2017!
Hi, I am Jamie Sherman, COO of Pollinator Partnership (P2), and I'm guest writing this BIP blog to highlight a great partnership project between BIP, P2 and many other friends of P2 - The Mite-A-Thon. You probably have heard of this already, and I'm writing today to make a special plea for your participation. Varroa mites are a big problem in beekeeping, some would argue - THE problem. Survey after survey shows that mite levels, especially in the fall, predict colony losses. Yet many beekeepers don't know what Varroa mite levels are. That's why we are doing the Mite-A-Thon, so we can get a real feel for…
Northern California Summer Update 2017
In northern California, after a wet winter and spring it has been a really dry and hot summer. In the spring I saw a lot more chalkbrood than normal, something that was noted nationwide by our other teams. Below are a few images of some of the worst cases photographed. It has been the hottest summer in the 6 years I have lived in northern California, with many weeks above 100F. I was able to document how dry it has been this summer as I traveled around and sampled honey bee colonies for BIP. Other than the heat, beekeepers in northern California have been dealing…
BIP National Loss Survey Comparison with NASS results
The National Agricultural Statistical Service (NASS) recently reported the results of its second honey bee colony loss survey. The Bee Informed Partnership (BIP) also recently published preliminary loss results covering the same period. Despite the differences in methodology and sample sizes, these two surveys yielded comparable results. Specifically, we estimate 33.23% losses based on the BIP survey, and we estimate 35.39% losses when we use BIP methods to calculate losses from the NASS survey (Table 1). This is reassuring as it suggests past BIP surveys are representative of national losses despite the non-random nature of the BIP respondent pool. Both of these surveys were created…