It’s incredible how fast time can pass when you are enthralled in something new and exciting. I have been in California for more than a year and it seems like yesterday that I was standing in my parent’s driveway saying good bye to my mom, dad, and brothers as Rob and I loaded up his car for our move out west. A lot has happened in a year and making the move to the west coast has been one of the most eye opening experiences of my life. It’s been challenging, rewarding, frustrating, and fun but most importantly it’s given me the opportunity to grow as a person in ways I would have never imagined.
Last week the culmination of a year’s work was carefully packaged and mailed out to each of the sixteen bee breeders participating in the Bee Informed Partnership. The packets that were mailed out included individual historical reports for each beekeeper along with a summer sampling summary report and a data disc.
Fourteen of the sixteen beekeepers we work with received an individual historical report which contained data that reported Varroa and Nosema levels from samples collected during our summer sampling period between May and July. At this point, some of the hives tested from May to July had been inspected and sampled by our team up to 5 times between July 2011 and July 2012. The historical reports not only included data from our most recent sampling but also listed information from all previous hive inspections and samples taken. Having a history of hives listed in a report such as this is one of the highlights of our program and something the beekeepers participating in our project have gotten excited about.
The summary reports were created to help digest and put into context data collected from the summer sampling period. The summary reports give beekeepers participating in our program a chance to see where their Varroa and Nosema levels compare to other beekeepers in the group by anonymously sharing information. Since we were able to collect samples from almost all of the beekeepers before they treated for Varroa and Nosema in 2012 the levels reported in this report are very telling of how effective and timely treatments were in each operation in the fall of last year. It also helps to give beekeepers an idea of how and when they might began to treat in the fall of this year.
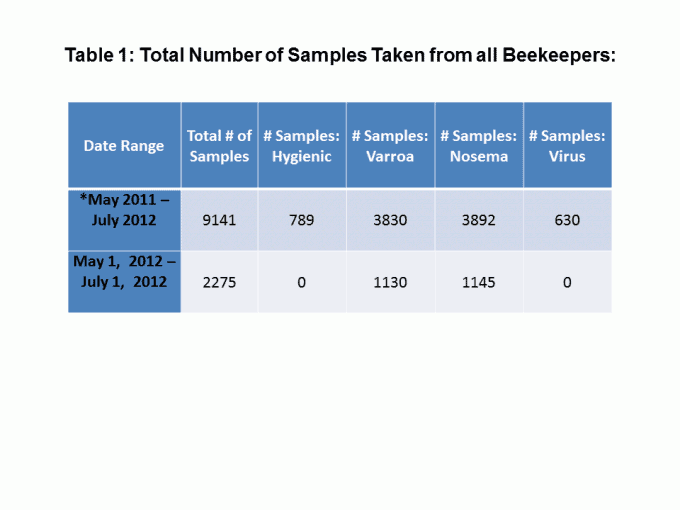
The data discs that were collated for each beekeeper included every report ever generated for them in the last year. There were 158 documents in all resulting from more than 9000 samples taken from May 2011 to May 2012 (Table 1). Although reports are always delivered to the beekeepers within two weeks of initial sample collection it is useful to have them all in one place that can easily be accessed. Hopefully the discs will make it easier for beekeepers to access any of their reports in a digital format that can be printed and reviewed at any time. Putting the reports together for each of the beekeepers was both challenging and rewarding. I have a new found respect for the time and effort that goes into analyzing data and creating reports that are as accurate and informative as possible. The goal is to summarize data after each sampling period to give beekeepers yet another tool to help them make more informed management decisions.
