Over the last year, and for the first time, the National Agricultural Statistical Service (NASS) conducted a survey to monitor colony losses. The Bee Informed Partnership (BIP), in collaboration with the Apiary Inspectors of America, has also recently published preliminary loss data covering the same time period.
While the core purpose of these two surveys are the same, to track honey bee colony losses in the US, there are significant and important differences in survey design (questions asked), delivery, data presentation, and the methodology by which loss rates are calculated. These differences mean that dissimilarities in loss rates reported by both surveys are expected. This blog is meant to help compare our results while highlighting differences and limitations of these comparisons. We do this in the hopes of helping beekeepers, academics, the general public and policy makers make sense of the current data.
The NASS report, with the full explanation of their sampling design and methodology can be found here: https://www.nass.usda.gov/Surveys/Guide_to_NASS_Surveys/Bee_and_Honey/
The BIP abstract can be found here: https://beeinformed.org/results/colony-loss-2015-2016-preliminary-results/, and an explanation of our methodology can be found in previous peer reviewed reports.
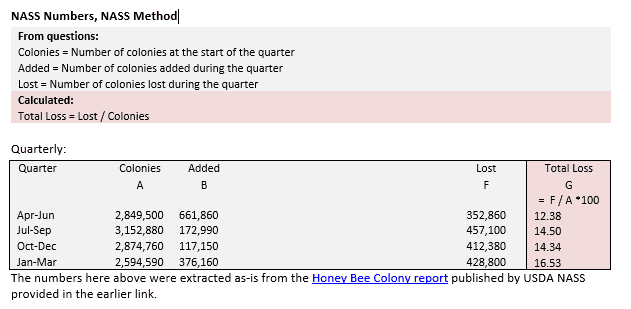
In order to compare NASS and BIP estimates, we combined the quarterly numbers published by NASS to correspond to BIP’s division of the season into “summer” and “winter” (see table 1). The details of those recalculations are provided at the end of this blog. It is important to note that the NASS personnel who coordinate this survey cannot comment on our methodology to compare loss rates so this was done by BIP personnel using publically available NASS data.

Both surveys present loss rates very differently. Most apparent, the Bee Informed Partnership present loss rates for the “summer” (April 1- Sept 30), “winter” (Oct 1 – March 31), and over the course of the year (April 1- April 1). The NASS survey presents the loss data in the 4 quarters (April 1 – June 30), (July 1- Sept 30), (Oct 1 – Dec 30) and (Jan 1 – April 1). Regrettably, the way that BIP collects data does not permit us to separate it into quarters, and so BIP data cannot be directly compared with NASS results for each quarter. However, by making some assumptions, we can rework NASS numbers and present them as two different seasons, as BIP reports them.
While tempting, it is not appropriate to simply add the loss rate for two quarters together to get a loss rate for a season. This is because the population of colonies under surveillance in distinct time periods is different than the total number of colonies that were under surveillance over the entire time period.
A non-bee example may help illustrate the point.
Say one had $1000 in stock starting on April 1, and lost 20% of these funds by Sept 31, they would have $ 800 remaining. If the stocks lost another 20% in the next 6 months, they would have 640 dollars left. If you were to calculate the annual loss rate by simply adding the loss rates in both seasons (20% + 20%) you would say the stock lost 40% of their value by, which would mean they should have $600 remaining, which they do not – they have $640 remain. The proper way to calculate the annual loss rate is to calculate independently over the entire season – so the stock had a value of $1000 in April 1, and had a value of $640 on March 31 the following year so the loss rate was 360/1000 = 36% not 40%.
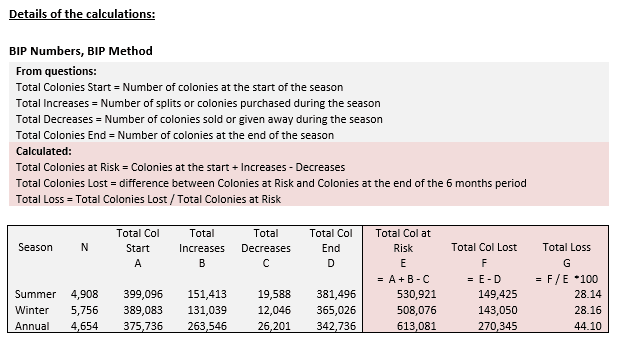
Another significant difference between surveys is how we calculate losses. NASS asked their respondents specifically how many colonies alive at the beginning of the quarter died. This method generally excludes counting any colonies that were made through splitting which died in the quarter. BIP methods calculate losses indirectly, that is, we calculate how many colonies there should have been at the end of a period if none died, and then consider the difference between the expected number of colonies (those at risk of dying) and how many remained alive. We then use these numbers to calculate the loss rate. This means that splits made during the specific seasons that died in the same season are counted as lost.
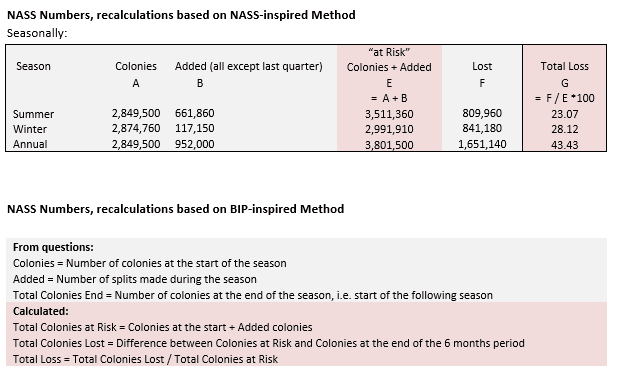
This difference suggests that BIP and NASS numbers would differ most when beekeepers split the most. According to both surveys, most beekeepers make splits in the summer, and so we would expect BIP summer losses to differ most during this season. Table 1 clearly shows this trend – as compared to BIP methods and BIP numbers the summer loss was higher than recorded if we use NASS numbers and NASS-influenced methods, or NASS numbers and BIP-influenced methods.
Another reason we expect differences in numbers stem from differences in sample design and respondents recruitment. NASS performed a stratified randomized sample of farming operations that have honey bee colonies. All migratory commercial operations were sampled, in addition to a representative sample of the small scale beekeepers (less than 5 colonies) that qualify as farms. As BIP does not possess a list of registered beekeepers in the US, we performed a sample of convenience, trying to reach a maximum numbers of beekeepers through different means (bee journals, internet, paper survey) and inviting participants to forward the invitation to their peers. The only requirement to be part of the BIP survey was to have colonies located in (at least) one US state or territory.
Given the variations in population targeted, sample sizes and methodology, we consider the numbers recorded by both surveys as fairly comparable. Both surveys show loss rates well in excess of what we would expect in a health bee population. Both surveys highlight the need to determine what is causing these high loss rates and provide solutions to beekeepers on how to steam these high loss rates.
This blog is written to provide a basis for comparison of these two very different survey methodologies and calculations. Understanding that presenting losses by quarter (NASS) and those by season (summer, winter and annual) (BIP) may cause confusion, we hope this blog helps bring some clarity to this discussion. Below we detail the assumptions we made when making comparison between surveys, and how we calculated the different loss rates by season and for the entire year that are shown in table 1.


NASS do not include in their estimates the splits (“added”) made during the respective quarter. In our opinion, when pooling 2 quarters together, the splits made during the first quarter need to be added to the pool of starting colonies, as their loss (if any) would be counted in the second quarter. We therefore included them in the divisor of our recalculations of seasonal loss estimates. For annual estimates, the additions from the first 3 quarters are added to the starting colonies. In each case, as per NASS standards, splits made during the most recent quarter (most recent splits) are not considered in the pool of colonies at risk. Those recalculations were based on our best judgement and only engage the Bee Informed Partnership. We welcome any recommendation on an alternative method to pool quarterly results into semester estimates.

To imitate the BIP methodology of indirect calculations of number of colonies lost over a season, we used the published numbers of colonies at the start and numbers of addition. The number of colonies at the end of the season was estimated using, when available, the number of colonies at the start of the following season or, if not, the calculated number of colonies resulting after additions and lost over the 2 quarters composing the season. Those recalculations of NASS numbers only engage the Bee Informed Partnership.
