Happy Fall y’all!
In normal life, “Fall” means Halloween (and dressing up as fatbody-sucking Varroa mite) and Thanksgiving (we certainly are grateful to be part of the beekeeper community).
In beekeeping life, “Fall” means that nectar flows come to an end, queens lay fewer eggs, winter bees are being reared and we have to (still) deal with Varroa mites. All this is happening for a reason: To get the bees ready for and successfully bring them through winter. (Hard to believe here in Alabama where it is still blazing hot!)
You may remember that we reported the highest honey bee colony winter losses since the beginning of the survey in 2006 (in case you don’t, you can read the abstract here)! Beekeepers across the nation lost 38% of their colonies over winter.
In some states, one would define this season as “ice-cold, snowy, and long”; in others, it’s merely “one month of cooler temperatures”. As variable as climatic conditions are, so are beekeeping practices among the 50 U.S. states. We do acknowledge this by grouping our data spatially and presenting them according to state, federal district, and territory.
Like in previous years, we are providing data for Annual, Summer and Winter colony losses. As usual, we are presenting both Total and Average Loss for each region and season. A little refresher on what the difference is between our Loss calculations:
Total Loss = every colony is treated the same or “every colony gets a vote”. Thus, Total Loss is more representative of commercial beekeepers who are managing most honey bee colonies in the country as the losses are weighted toward those who manage more colonies.
Average Loss = every beekeeper is treated the same no matter how many colonies are managed by this individual. In other words, each operation, no matter how small or large, “gets only 1 vote”. We use operational loss then to calculate average loss. Therefore, Average Loss is more representative of backyard beekeepers since they make up the majority of the U.S. beekeeping community (numerically speaking).
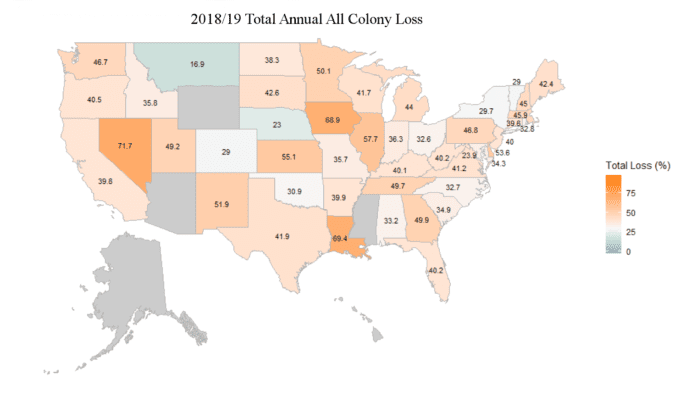
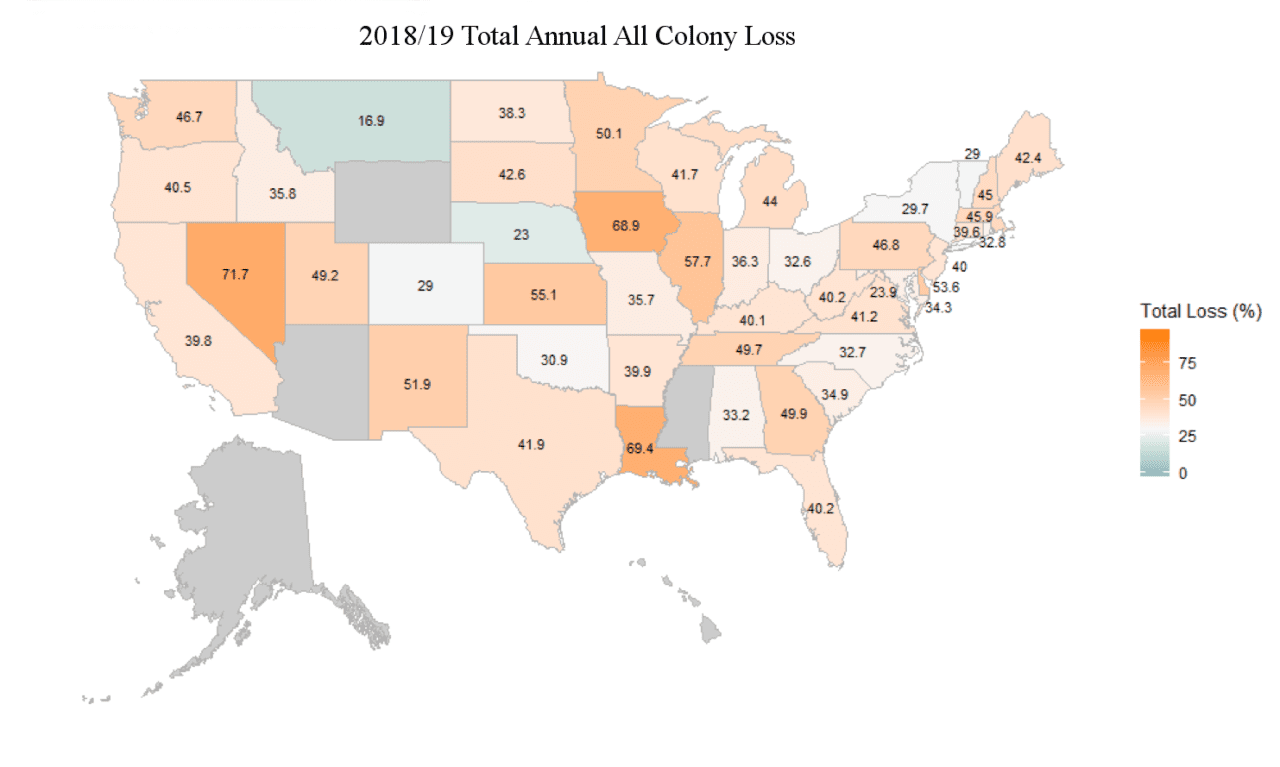
Here, we included summary tables of our data as well as a map showing Total Annual Losses specific to each state (see below Figure 1; tables 1, 2 and 3).
To view even more region-specific data (e.g. Winter and Summer losses), head over to BIP’s Interactive Loss Map. In addition to nicely colored maps from various years, you can also compare the number of respondents. That being said: The more responses we receive, the more representative our data is. So: Spread the word and encourage your beekeeper friends to participate in the survey next Spring!
Some of you may sit there, eyes closed, fingers hovering over the mouse, dreading that their state had among the highest colony losses this year. Well, here we go!

Figure 1: Annual Total Colony Loss by state and federal district between 1 April 2018 and 1 April 2019.
Quick side note which will help to read the tables: N represents the number of beekeepers that responded from each state/district/territory. If a state had less than 5 participating beekeepers, we note that with a “<5” in the tables below and do not share the losses for privacy reasons. If you are in a state with fewer than 5 participating beekeepers, start talking among your fellow organizations and see if you can set that as a goal next year! We would love to have enough participants next year to have a full map.
Blog by Selina Bruckner Ph.D. Student at Auburn University
Table 1: Annual Total Loss and Average Loss by state, federal district, and territory between 1 April 2018 and 1 April 2019
| Season | State | N | Total Loss | Average Loss |
| ANNUAL | Alabama | 61 | 33.2 | 30.3 |
| ANNUAL | Alaska | <5 | NA | NA |
| ANNUAL | Arizona | <5 | NA | NA |
| ANNUAL | Arkansas | 43 | 39.9 | 44.7 |
| ANNUAL | California | 130 | 39.8 | 45.2 |
| ANNUAL | Colorado | 101 | 29.0 | 51.1 |
| ANNUAL | Connecticut | 20 | 39.6 | 47.2 |
| ANNUAL | District of Columbia | 8 | 23.9 | 31.9 |
| ANNUAL | Delaware | 13 | 53.6 | 54.6 |
| ANNUAL | Florida | 32 | 40.2 | 32.6 |
| ANNUAL | Georgia | 81 | 49.9 | 48.1 |
| ANNUAL | Hawaii | <5 | NA | NA |
| ANNUAL | Idaho | 24 | 35.8 | 52.2 |
| ANNUAL | Illinois | 80 | 57.7 | 63.2 |
| ANNUAL | Indiana | 97 | 36.3 | 45.9 |
| ANNUAL | Iowa | 68 | 68.9 | 61.8 |
| ANNUAL | Kansas | 28 | 55.1 | 54.9 |
| ANNUAL | Kentucky | 85 | 40.1 | 45.6 |
| ANNUAL | Louisiana | 7 | 69.4 | 36.1 |
| ANNUAL | Maine | 49 | 42.4 | 48.5 |
| ANNUAL | Maryland | 162 | 34.3 | 44.4 |
| ANNUAL | Massachusetts | 69 | 45.9 | 48.6 |
| ANNUAL | Michigan | 153 | 44.0 | 48.9 |
| ANNUAL | Minnesota | 76 | 50.1 | 64.4 |
| ANNUAL | Mississippi | <5 | NA | NA |
| ANNUAL | Missouri | 79 | 35.7 | 34.0 |
| ANNUAL | Montana | 19 | 16.9 | 39.3 |
| ANNUAL | Nebraska | 13 | 23.0 | 65.3 |
| ANNUAL | Nevada | 15 | 71.7 | 57.9 |
| ANNUAL | New Hampshire | 29 | 45.0 | 51.3 |
| ANNUAL | New Jersey | 54 | 40.0 | 55.3 |
| ANNUAL | New Mexico | 14 | 51.9 | 68.5 |
| ANNUAL | New York | 103 | 29.7 | 48.0 |
| ANNUAL | North Carolina | 176 | 32.7 | 42.1 |
| ANNUAL | North Dakota | 18 | 38.3 | 40.8 |
| ANNUAL | Ohio | 142 | 32.6 | 38.2 |
| ANNUAL | Oklahoma | 62 | 30.9 | 37.6 |
| ANNUAL | Oregon | 97 | 40.5 | 55.6 |
| ANNUAL | Pennsylvania | 486 | 46.8 | 52.1 |
| ANNUAL | Puerto Rico | 0 | NA | NA |
| ANNUAL | Rhode Island | 13 | 32.8 | 27.9 |
| ANNUAL | South Carolina | 35 | 34.9 | 35.9 |
| ANNUAL | South Dakota | 12 | 42.6 | 42.9 |
| ANNUAL | Tennessee | 60 | 49.7 | 42.4 |
| ANNUAL | Texas | 127 | 41.9 | 34.0 |
| ANNUAL | Utah | 94 | 49.2 | 65.3 |
| ANNUAL | Vermont | 36 | 29.0 | 66.6 |
| ANNUAL | Virginia | 495 | 41.2 | 49.7 |
| ANNUAL | Washington | 114 | 46.7 | 66.8 |
| ANNUAL | West Virginia | 35 | 40.2 | 51.3 |
| ANNUAL | Wisconsin | 90 | 41.7 | 56.8 |
| ANNUAL | Wyoming | <5 | NA | NA |
| ANNUAL | Other | 0 | NA | NA |
| ANNUAL | MultiStateOperation | 107 | 39.6 | 39.5 |
