By now, we hope that you have taken time to reflect on this past year’s honey bee colony losses – both your own losses, as well as those experienced by beekeepers across the nation. In case you missed it, you can view our official preliminary results abstract here: https://beeinformed.org/wp-content/uploads/2019/11/2017-2018-Abstract.pdf
We fared worse this year compared to the previous one, but long-term BIP efforts over the past decade suggest that we actually experienced a relatively ‘normal’ year. That means about 40% of our colonies died!
The United States is vast, and extremely diverse. Everyone can appreciate that beekeeping in the desert oases of the southwest is very different from beekeeping in the forests of New England. Hence the importance of spatially grouping our data. Each year, BIP conveys that information according to state, federal district, and territory.
This year, like previous ones, we present preliminary data for Annual, Winter, and Summer Losses. For each period and region, Total Loss and Average Loss are communicated. It’s important to understand the difference, as one type is likely more relevant to you than the other!
Total Loss treats each colony the same. In other words, one colony has one vote. This means that Total Loss is more representative of commercial beekeepers, as they manage most honey bee colonies in the country.
Average Loss, on the other hand, treats each beekeeper the same – one beekeeper has one vote. Therefore, Average Loss is more representative of the experiences of backyard beekeepers, as they vastly out-number sideline and commercial individuals.
To view region-specific data, check out BIP’s Interactive Loss Map: https://research.beeinformed.org/loss-map/.
There you can compare losses among years and regions, and even see how many beekeepers responded to the survey.
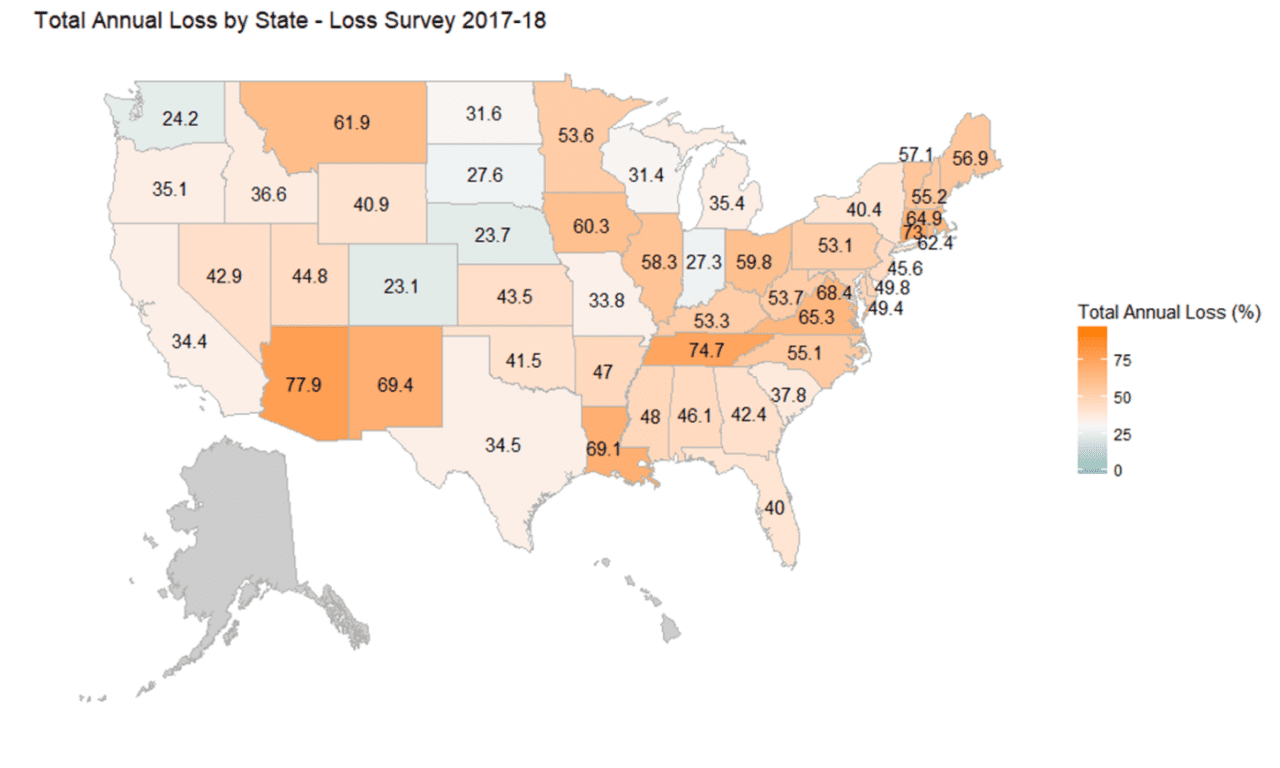
Figure 1 illustrates just one of the maps that our Interactive Loss Map can produce. We have also included summaries of the data in tabular formats (see Tables 1, 2 and 3).
Please note that N represents the number of beekeepers that responded from each state/district/territory. To preserve confidentiality, we have not released information for states and territories with five or fewer respondents. This means Alaska, Puerto Rico, and in some cases Hawaii, were excluded.
Table 1: Annual Total Loss and Average Loss by state, federal district, and territory between 1 April 2017 – 1 April 2018.
| Season | State | N | Total Loss | Average Loss |
|---|---|---|---|---|
| ANNUAL | Alabama | 52 | 46.1 | 39.6 |
| ANNUAL | Alaska | 0 | NA | NA |
| ANNUAL | Arizona | 6 | 77.9 | 37.7 |
| ANNUAL | Arkansas | 32 | 47.0 | 42.3 |
| ANNUAL | California | 111 | 34.4 | 41.4 |
| ANNUAL | Colorado | 81 | 23.1 | 54.4 |
| ANNUAL | Connecticut | 33 | 73.0 | 65.0 |
| ANNUAL | District of Columbia | 6 | 68.4 | 74.3 |
| ANNUAL | Delaware | 19 | 49.8 | 65.8 |
| ANNUAL | Florida | 52 | 40.0 | 38.8 |
| ANNUAL | Georgia | 132 | 42.4 | 55.2 |
| ANNUAL | Hawaii | 4 | NA | NA |
| ANNUAL | Idaho | 26 | 36.6 | 41.4 |
| ANNUAL | Illinois | 100 | 58.3 | 60.1 |
| ANNUAL | Indiana | 115 | 27.3 | 52.3 |
| ANNUAL | Iowa | 82 | 60.3 | 59.6 |
| ANNUAL | Kansas | 25 | 43.5 | 38.5 |
| ANNUAL | Kentucky | 96 | 53.3 | 45.8 |
| ANNUAL | Louisiana | 11 | 69.1 | 34.8 |
| ANNUAL | Maine | 57 | 56.9 | 53.9 |
| ANNUAL | Maryland | 121 | 49.4 | 64.2 |
| ANNUAL | Massachusetts | 83 | 64.9 | 56.8 |
| ANNUAL | Michigan | 198 | 35.4 | 68.1 |
| ANNUAL | Minnesota | 74 | 53.6 | 72.1 |
| ANNUAL | Mississippi | 12 | 48.0 | 35.4 |
| ANNUAL | Missouri | 70 | 33.8 | 34.9 |
| ANNUAL | Montana | 17 | 61.9 | 56.8 |
| ANNUAL | Nebraska | 13 | 23.7 | 48.6 |
| ANNUAL | Nevada | 12 | 42.9 | 42.1 |
| ANNUAL | New Hampshire | 40 | 55.2 | 50.1 |
| ANNUAL | New Jersey | 68 | 45.6 | 58.1 |
| ANNUAL | New Mexico | 17 | 69.4 | 52.7 |
| ANNUAL | New York | 121 | 40.4 | 53.1 |
| ANNUAL | North Carolina | 226 | 55.1 | 60.6 |
| ANNUAL | North Dakota | 12 | 31.6 | 60.5 |
| ANNUAL | Ohio | 169 | 59.8 | 55.9 |
| ANNUAL | Oklahoma | 26 | 41.5 | 34.3 |
| ANNUAL | Oregon | 92 | 35.1 | 43.3 |
| ANNUAL | Pennsylvania | 456 | 53.1 | 60.0 |
| ANNUAL | Puerto Rico | 1 | NA | NA |
| ANNUAL | Rhode Island | 14 | 62.4 | 67.6 |
| ANNUAL | South Carolina | 61 | 37.8 | 51.7 |
| ANNUAL | South Dakota | 13 | 27.6 | 62.8 |
| ANNUAL | Tennessee | 74 | 74.7 | 59.1 |
| ANNUAL | Texas | 90 | 34.5 | 37.8 |
| ANNUAL | Utah | 127 | 44.8 | 53.8 |
| ANNUAL | Vermont | 44 | 57.1 | 68.3 |
| ANNUAL | Virginia | 460 | 65.3 | 68.1 |
| ANNUAL | Washington | 96 | 24.2 | 48.0 |
| ANNUAL | West Virginia | 48 | 53.7 | 56.4 |
| ANNUAL | Wisconsin | 116 | 31.4 | 78.5 |
| ANNUAL | Wyoming | 7 | 40.9 | 43.3 |
| ANNUAL | MultiStateOperation | 100 | 33.9 | 47.2 |
Table 2: Winter Total Loss and Average Loss by state, federal district, and territory between 1 October 2017 – 1 April 2018.
| Season | State | N | Total Loss | Average Loss |
|---|---|---|---|---|
| WINTER | Alabama | 65 | 37.9 | 30.4 |
| WINTER | Alaska | 0 | NA | NA |
| WINTER | Arizona | 6 | 71.9 | 19.1 |
| WINTER | Arkansas | 42 | 17.1 | 24.7 |
| WINTER | California | 136 | 25.3 | 32.1 |
| WINTER | Colorado | 114 | 12.6 | 42.6 |
| WINTER | Connecticut | 49 | 54.3 | 56.2 |
| WINTER | District of Columbia | 10 | 57.1 | 64.2 |
| WINTER | Delaware | 26 | 38.7 | 66.0 |
| WINTER | Florida | 57 | 18.4 | 23.9 |
| WINTER | Georgia | 150 | 30.9 | 45.5 |
| WINTER | Hawaii | 4 | NA | NA |
| WINTER | Idaho | 34 | 25.8 | 42.9 |
| WINTER | Illinois | 120 | 53.5 | 52.5 |
| WINTER | Indiana | 139 | 20.1 | 46.8 |
| WINTER | Iowa | 91 | 40.7 | 54.4 |
| WINTER | Kansas | 29 | 19.4 | 32.7 |
| WINTER | Kentucky | 112 | 34.4 | 35.7 |
| WINTER | Louisiana | 13 | 60.5 | 25.7 |
| WINTER | Maine | 78 | 46.0 | 53.3 |
| WINTER | Maryland | 152 | 33.6 | 60.3 |
| WINTER | Massachusetts | 100 | 58.8 | 57.9 |
| WINTER | Michigan | 284 | 25.4 | 64.7 |
| WINTER | Minnesota | 101 | 44.0 | 68.0 |
| WINTER | Mississippi | 12 | 36.8 | 24.2 |
| WINTER | Missouri | 85 | 20.7 | 23.5 |
| WINTER | Montana | 22 | 41.2 | 53.7 |
| WINTER | Nebraska | 14 | 14.0 | 35.7 |
| WINTER | Nevada | 16 | 26.1 | 34.2 |
| WINTER | New Hampshire | 52 | 51.2 | 44.2 |
| WINTER | New Jersey | 77 | 38.8 | 51.9 |
| WINTER | New Mexico | 18 | 44.2 | 48.1 |
| WINTER | New York | 154 | 27.8 | 46.6 |
| WINTER | North Carolina | 258 | 42.2 | 50.7 |
| WINTER | North Dakota | 13 | 25.2 | 52.9 |
| WINTER | Ohio | 211 | 51.9 | 51.8 |
| WINTER | Oklahoma | 32 | 23.4 | 23.7 |
| WINTER | Oregon | 122 | 24.8 | 35.8 |
| WINTER | Pennsylvania | 607 | 46.7 | 55.2 |
| WINTER | Puerto Rico | 1 | NA | NA |
| WINTER | Rhode Island | 19 | 51.2 | 57.1 |
| WINTER | South Carolina | 64 | 24.4 | 43.1 |
| WINTER | South Dakota | 14 | 22.9 | 57.9 |
| WINTER | Tennessee | 80 | 65.0 | 46.4 |
| WINTER | Texas | 101 | 26.6 | 26.9 |
| WINTER | Utah | 163 | 35.3 | 43.1 |
| WINTER | Vermont | 57 | 53.2 | 64.6 |
| WINTER | Virginia | 551 | 59.5 | 59.1 |
| WINTER | Washington | 134 | 21.8 | 36.8 |
| WINTER | West Virginia | 60 | 41.8 | 48.1 |
| WINTER | Wisconsin | 156 | 21.0 | 73.3 |
| WINTER | Wyoming | 9 | 33.3 | 39.5 |
| WINTER | MultiStateOperation | 117 | 24.9 | 40.2 |
Table 3: Summer Total Loss and Average Loss by state, federal district, and territory between 1 April 2017– 1 October 2017.
| Season | State | N | Total Loss | Average Loss |
|---|---|---|---|---|
| SUMMER | Alabama | 57 | 14.4 | 17.6 |
| SUMMER | Alaska | 0 | NA | NA |
| SUMMER | Arizona | 7 | 31.6 | 27.6 |
| SUMMER | Arkansas | 35 | 37.3 | 29.1 |
| SUMMER | California | 120 | 16.0 | 21.2 |
| SUMMER | Colorado | 87 | 12.7 | 22.2 |
| SUMMER | Connecticut | 36 | 22.2 | 21.9 |
| SUMMER | District of Columbia | 6 | 15.8 | 12.5 |
| SUMMER | Delaware | 20 | 21.4 | 18.6 |
| SUMMER | Florida | 61 | 33.1 | 25.2 |
| SUMMER | Georgia | 142 | 20.2 | 24.1 |
| SUMMER | Hawaii | 6 | 11.9 | 9.7 |
| SUMMER | Idaho | 27 | 19.1 | 10.9 |
| SUMMER | Illinois | 104 | 17.1 | 19.0 |
| SUMMER | Indiana | 117 | 13.5 | 12.4 |
| SUMMER | Iowa | 85 | 38.6 | 17.1 |
| SUMMER | Kansas | 25 | 37.0 | 9.6 |
| SUMMER | Kentucky | 99 | 33.5 | 20.5 |
| SUMMER | Louisiana | 14 | 15.1 | 18.1 |
| SUMMER | Maine | 59 | 10.6 | 12.9 |
| SUMMER | Maryland | 123 | 24.8 | 20.4 |
| SUMMER | Massachusetts | 87 | 37.2 | 16.2 |
| SUMMER | Michigan | 203 | 18.4 | 16.5 |
| SUMMER | Minnesota | 75 | 29.8 | 17.1 |
| SUMMER | Mississippi | 13 | 31.5 | 22.8 |
| SUMMER | Missouri | 71 | 15.0 | 15.1 |
| SUMMER | Montana | 19 | 10.7 | 26.5 |
| SUMMER | Nebraska | 13 | 11.4 | 25.2 |
| SUMMER | Nevada | 13 | 28.8 | 13.8 |
| SUMMER | New Hampshire | 40 | 7.0 | 12.4 |
| SUMMER | New Jersey | 70 | 15.8 | 16.3 |
| SUMMER | New Mexico | 19 | 52.8 | 22.3 |
| SUMMER | New York | 126 | 21.8 | 18.0 |
| SUMMER | North Carolina | 237 | 19.7 | 20.2 |
| SUMMER | North Dakota | 13 | 11.7 | 23.6 |
| SUMMER | Ohio | 179 | 17.7 | 19.1 |
| SUMMER | Oklahoma | 32 | 33.3 | 22.9 |
| SUMMER | Oregon | 92 | 16.6 | 10.4 |
| SUMMER | Pennsylvania | 468 | 15.3 | 14.9 |
| SUMMER | Puerto Rico | 1 | NA | NA |
| SUMMER | Rhode Island | 15 | 22.8 | 14.5 |
| SUMMER | South Carolina | 67 | 19.9 | 18.0 |
| SUMMER | South Dakota | 15 | 6.3 | 17.9 |
| SUMMER | Tennessee | 85 | 28.4 | 31.9 |
| SUMMER | Texas | 95 | 12.9 | 18.5 |
| SUMMER | Utah | 133 | 15.9 | 17.8 |
| SUMMER | Vermont | 46 | 8.8 | 20.5 |
| SUMMER | Virginia | 484 | 20.2 | 21.2 |
| SUMMER | Washington | 100 | 7.3 | 18.2 |
| SUMMER | West Virginia | 48 | 16.7 | 13.1 |
| SUMMER | Wisconsin | 118 | 13.6 | 18.4 |
| SUMMER | Wyoming | 7 | 23.4 | 21.7 |
| SUMMER | MultiStateOperation | 105 | 15.5 | 18.4 |