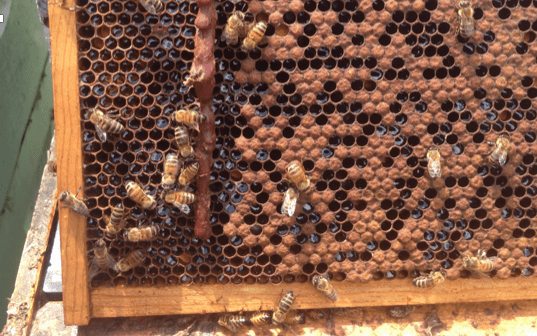
This blog comes to you from the Southern part of the U.S. – Alabama specifically – where beekeepers are currently sweating away as they diligently check their colonies for food and mites! They’re preparing for winter already!
As you know, these past months has been unusual in many ways.
For example, lots of beekeepers report difficulties finding sugar right now. Another example comes from the 2019/20 BIP Colony Loss Survey results.
If you’ve read this year’s abstract or watched the news, you already know that we recently reported that beekeepers experienced the highest honey bee colony summer losses on record last year (2019). It was one of those rare times when beekeepers experienced higher losses in the summer than winter. Like in previous years, summer losses were driven by commercial beekeepers (managing 500+ colonies) who lost more colonies compared to sideliner and backyard beekeepers (managing 50-500 and 1-50 colonies, respectively). However, Summer 2019 seemed to have hit commercial beekeepers particularly hard.
Given all the “unusuals” of the past year, we stuck to the traditional BIP colony loss map to present state-specific results for Annual, Summer and Winter colony losses for the 2019/20 season.
As in previous years, we present both Total and Average Loss for each region and season; individual loss rates are aggregated by either summing up each operation’s losses according to the number of colonies they owned or not.
Wondering what the difference between the two types of losses is? Here’s a quick explanation:
- Total Loss = every colony is treated equally. Thus, Total Loss is more representative of commercial beekeepers who are managing most of the honey bee colonies in the country.
- Average Loss = every beekeeper is treated the same, no matter how many colonies they manage. Therefore, Average Loss is more representative of backyard beekeepers since they make up the majority of the U.S. beekeepers.
Depending on the number of respondents of each state and the variability in their responses we can be more or less confident in state-level loss rates. As a measure of confidence, we are using “Confidence intervals” which reveal the range of plausible loss estimates. The narrower the confidence interval, the better! It means that we have a good idea of what the actual state loss rate was.
Broad confidence intervals (=we don’t have a good idea of the actual state loss rate) occur when states have low participation rates or extremely high variability in beekeeper responses.
There is an elegant way to account for this though: A statistical tool called “bootstrapping”.
For example, instead of calculating the Total Loss for Alabama just once, this tool is doing it thousands of times! It shuffles the 68 state-specific respondents like cards and keeping some out every time, thereby reducing the variability in the calculated estimates.
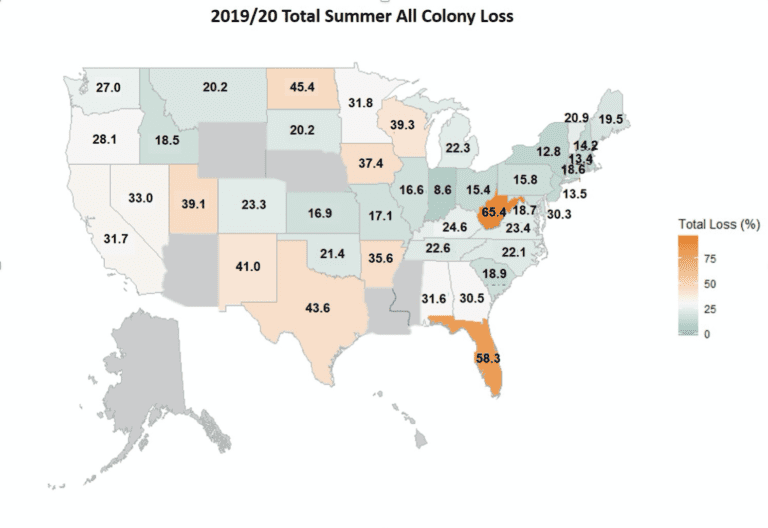
Let’s switch from technicalities to visuals. Here we present the traditional BIP map showing Total Summer Losses specific to each state.
If you want to take it a step further, head over to the BIP’s Interactive Loss Map. This tool gives you the opportunity to look at the region-specific data for Winter and Annual losses of this year’s survey. You also get the chance to compare estimates between “Operation Types” – i.e. beekeepers that keep their colonies exclusively in one state (“Single State Only”) versus having apiaries in multiple states (“Multiple State Only”).
Or perhaps you see some trends emerging when you look at results from previous years? This is the opportunity afforded by a long-term dataset! We’re proud of it. And we’re so grateful for your efforts to make this happen!