As a national organization the Bee Informed Partnership (BIP) is fortunate to collaborate with beekeepers, scientists and educators around the country. These relationships manifest in many different forms but are linked by the common thread of seeking to better understand honey bee health and find ways to improve it. One of BIP’s longstanding collaborations has been with the New York State (NYS) Beekeeper Tech Team.
The NYS Tech Team program originated in 2016 with funding from the NYS Environmental Protection Fund to address unsustainable colony loss rates throughout the state. The program is carried out by Cornell University in collaboration with NYS Department of Agriculture and Markets. Cornell has a deep history of honey bee research based at the Dyce Lab that focuses on supporting all NYS beekeepers – from hobbyists to large-scale commercial operations – through their applied research and educational programing. Beekeepers that participate in this program receive both in-field colony health inspections as well as consultations about their individual beekeeping and business challenges. Since the program’s inception, BIP has contributed to this effort by providing colony inspection and sampling services to the participating NYS commercial beekeepers, with sample processing and reporting being handled by University of Maryland’s Honey Bee lab. These beekeepers can stay enrolled in the program for three years and it’s been a pleasure getting to know them and their bees over time.
In New York State, an estimated 3000 beekeepers manage bees for a variety of purposes including production of honey and other hive products, live bee production (queens and nucs), and crop pollination throughout the state’s diverse agricultural landscape. Reported honey yields in recent years have been in the 50-65 lbs/colony range with much of the potential crop coming in the late summer and fall from Japanese knotweed (Polygonum cuspidatum) and Goldenrod (Solidago spp.) blooms. Just like many regions of the US, New York beekeepers have been experiencing unsustainable colony losses over the past decade, ranging from 42% to 68% each year (https://research.beeinformed.org/loss-map/). Most losses occur over New York’s long, cold, and snowy winter season.
Over the past five years we’ve helped the NYS Beekeeper Tech Team sample 1,380 unique colonies from 89 beekeeping operations. During each inspection, we assess the hive’s population, queen status, and brood pattern. We also look for a variety of hive pests and diseases, and take samples for laboratory quantification of Varroa, Nosema, viruses and pesticides. By tagging the hives we sample and following up with the same colonies over time when possible, we have been able to identify some trends in the New York beekeeping industry. In this blog post, we’ll highlight what we’ve learned from working with these beekeepers related to 3 key issues: Varroa, seasonality and pesticides. The figures presented below are republished with permission from the original NYS Beekeeper Tech Team Reports. Further information and results are included in the complete reports that are available as PDFs for download.
- Varroa continues to be a challenge for New York State Beekeepers
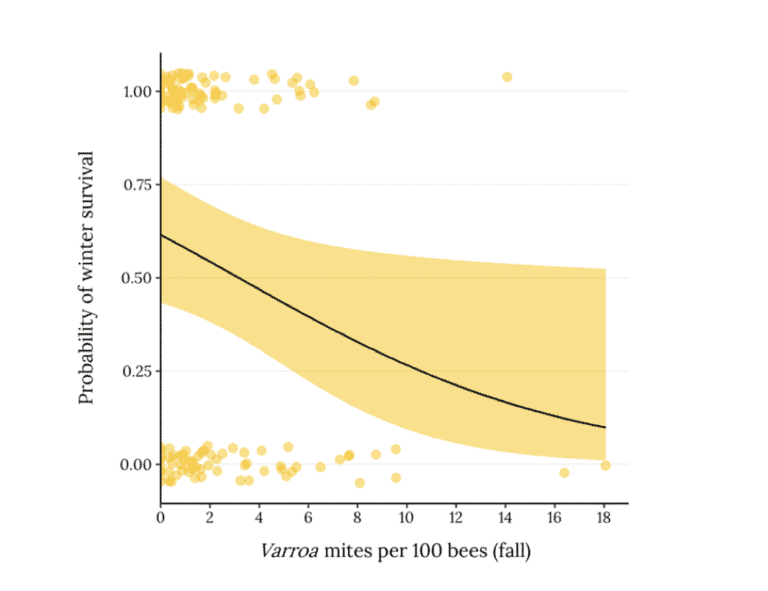
The biggest takeaway from the NYS Tech Team program data so far comes as no surprise to beekeepers: Varroa is a significant predictor of colony mortality (Hinsley et al., 2019)(Figure 3). This pesky parasite is a big threat to colony health and is one that is tricky to effectively control. The beekeepers we’ve worked with are very aware of the dangers of Varroa, and all of the commercial beekeepers we sample are applying treatments to manage them. Yet, Varroa control often remains difficult to attain, and as a result it continues to kill a lot of the state’s colonies. We found it interesting that other factors like Nosema, population size, pesticide load, and pesticide risk did not emerge as predictors of winter loss.
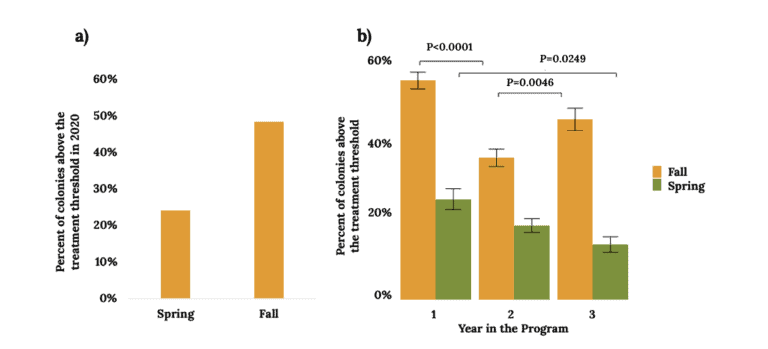
Each year we see colonies tend to have tolerable Varroa levels in the spring but dangerous levels in autumn. In 2020, average Varroa levels in June were 1.6%, but in September they were 4.9%. Similarly, only 24% of colonies we sampled in June exceeded the 2% spring treatment threshold, but in September roughly half (48%) did (3% autumn threshold; Figure 4). It’s clear that Varroa control becomes more difficult as the beekeeping season progresses. The good news is beekeepers have been eager to learn about colony health and are keen to improve their practices where they can and we’ve seen significant improvements in management practices over time. More beekeepers are now monitoring and many are changing their treatment options and timing to try to maintain low Varroa levels all season long. If you’d like to see what treatments New York beekeepers are using and when, check out the full 2020 NYS Beekeeper Tech Team Report.
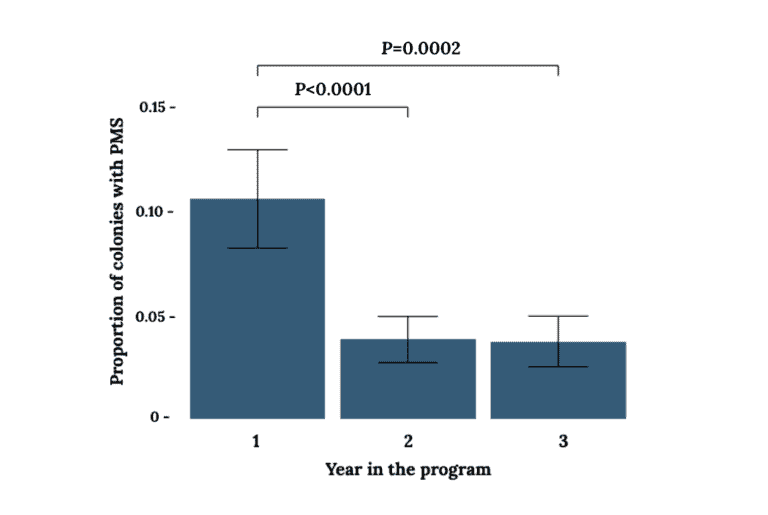
Beekeepers in the program have been improving their management practices and, likely as a result, we’re starting to see their colonies are looking healthier. One indicator that reflects this is the incidence of Parasitic Mite Syndrome (PMS). Parasitic Mite Syndrome (aka Varroa mite syndrome) is a condition characterized by advanced Varroa mite infestation and viral infection. It’s a good indicator of chronic mite pressure, and so we tend to see it in late summer and autumn if Varroa levels haven’t been well managed throughout the season. We’ve seen that beekeeping operations in the NYS Tech Team program have 44% lower incidence of Parasitic Mite Syndrome in subsequent years of their participation compared to the first year (Figure 5). Results like these are promising both for us and beekeepers to see.
- Colony health indicators show a seasonal pattern
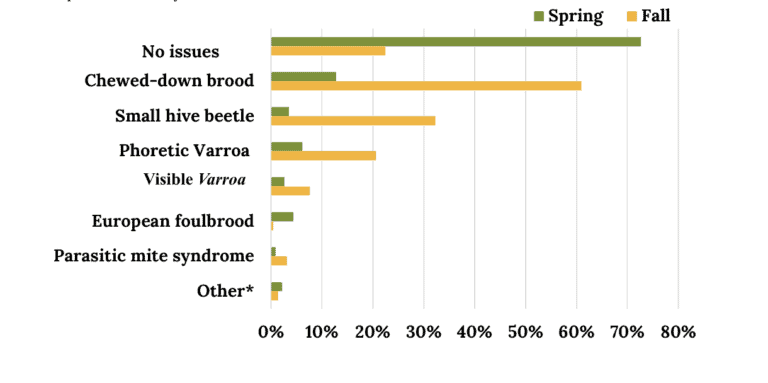
For five years we’ve inspected colonies every June and September and clear colony health patterns have emerged. Our 2020 data reflect what we tend to see each year (Figure 6). Overall, colonies look healthier in spring and most colonies present no signs of disease or pests whatsoever. European foulbrood and chalkbrood are conditions that are more common in spring compared to fall, but these diseases are rarely observed. But in the autumn our inspections tell a very different story. At this time of year, we observe issues in over 75% of the colonies we inspect. With winter right around the corner, this is a stressful time for colonies to face health problems and a challenging time for beekeepers to address them. In fall, most issues we observe are indicative of Varroa.
The signs of Varroa pressure that we see most often during our inspections include chewed-down brood, deformed wing virus and mites visible on bees on bees and brood. It’s not surprising that we see these signs; as we’ve learned, mite levels are highest in fall and a much greater percentage of colonies inspected at this time are above the 3% treatment threshold. Parasitic Mite Syndrome was not common in either summer or fall 2020, but was more prevalent in the fall compared to spring. Small hive beetles are also more commonly observed in fall.
All beekeepers can keep an eye out for these issues during their colony inspections. If signs of Varroa pressure are observed, take a moment to monitor colonies and see if it’s time for a treatment.
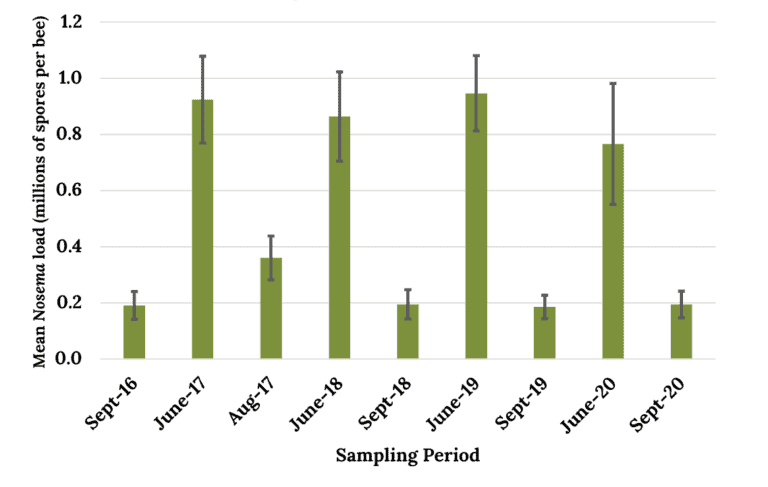
Nosema also follows a clear seasonal pattern. In New York State, Nosema spore loads are consistently higher in spring than they are in fall (Figure 7). The good news is we’ve found that most infections clear up on their own without the use of any treatment. As the weather warms, bees are able to void spores by defecating outside, which might help explain why we see reduced autumn infection. In 2020, 95% of the colonies that had high spore loads (1 million spores per bee) in spring, had autumn infection rates that were either reduced to a tolerable level or entirely eliminated.
- Pesticides are common in bee hives
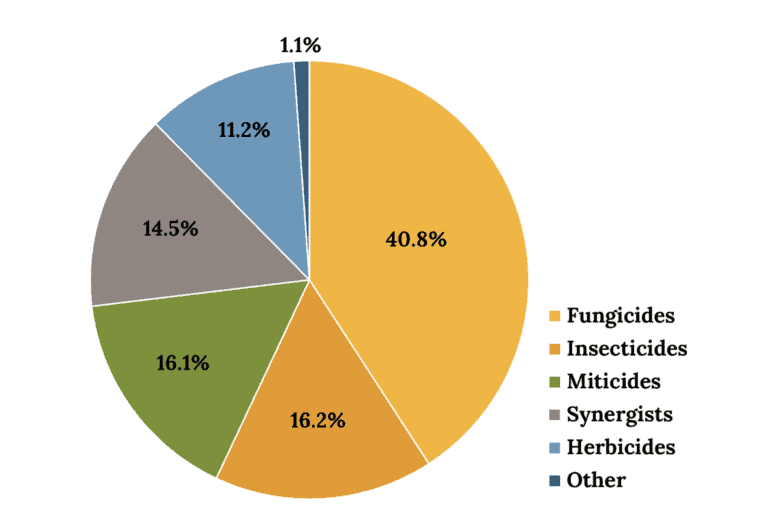
Our last takeaway is that most honey bees in New York are exposed to a variety of pesticides. Many pesticides are lipophilic (fat-loving) and so they can accumulate and remain in wax for extended periods of time. Looking at pesticides present in beeswax can give us an idea of bees’ cumulative and chronic exposure to pesticides. As part of the NYS Tech Team program, we take beeswax samples every year during our inspections that are tested to determine whether pesticides are present and at what concentrations. Over the past five years we’ve found that agrochemicals are ubiquitous in New York colonies, with 98.7% of hives containing pesticides. On average, colonies contain 6.56 different pesticides. Fungicides are most commonly found, followed by insecticides and miticides (Figure 8).
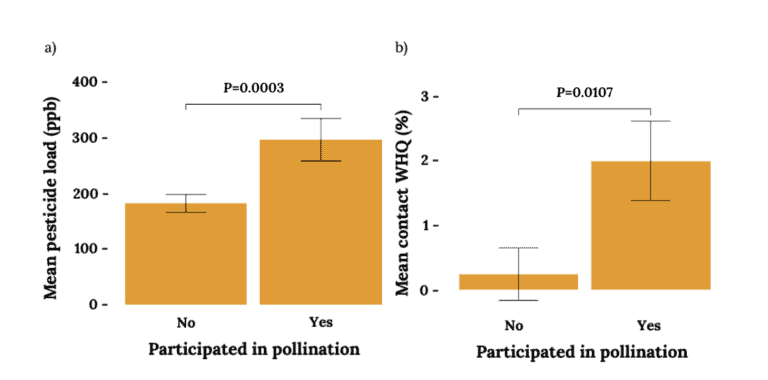
Commercial colonies have the most pesticides per hive compared to smaller scale beekeepers. We think this is driven primarily by pollination services. Our data show that pollination services are a key avenue for pesticide exposure. Colonies that participated in pollination had a significantly greater pesticide load and pesticide risk (which we report as a “wax hazard quotient”) than colonies that were not used for pollination (Figure 9). To help reduce pesticide exposure, we encourage beekeepers to foster open communication with growers and to regularly rotate old combs from their hives.
In 2021, the NYS Beekeeper Tech Team looks forward to continuing to work with beekeepers in the state to provide colony health information and consultation, and BIP appreciates the ongoing opportunity to assist in supporting the bees and beekeepers of New York. Beekeepers within New York that are interested in learning more about the program and the potential to participate in 2021 can find more information and contact info available here.
References
Hinsley, C. A., C. M. Urbanowicz, P. Cappy, T.A. Grout, S. H. McArt and E. K. Mullen. 2019. 2018 New York State Beekeeper Tech Team Report, Cornell University.