This year’s Sentinel Apiary Program has got some new flavor!
If you are a returning Sentinel participant, you will have noticed a big change in the Sentinel program protocol this year. In 2022, instead of testing Nosema levels at six monthly intervals, you received two months of Nosema results tested from samples collected in the early part of the season. You also received one composite pesticide sample. As in past years, you continue to receive six months of Varroa lab results to keep you updated on your current mite loads. And more good news! These results are now provided to you at a faster pace than in past years, which will help you make swifter, data-driven management decisions!
The Sentinel mobile application, which was introduced to Sentinel participants last year, is again available in 2022. Designed by BIP’s IT team, the mobile app allows beekeepers to use their mobile devices to directly enter and save inspection notes and other colony health and management information throughout the year — even for colonies that aren’t not part of the Sentinel program!
All Sentinel participants are invited to join our monthly Sentinel Collective webinars, which typically feature a brief presentation on a variety of research topics, and include some amazing guest presenters. This is followed by an open forum for participants to connect with one another and ask the BIP team any questions they may have. Finally, this year we are also keeping in touch with you through the Sentinel newsletter.
NEW: Pesticide Residue Data
Last year, Sentinel participants shared their interest in reducing the number of Nosema samples tested in place of receiving pesticide residue results. This is not our first foray into pesticide analyses, but this is the first time we have offered residue analysis to all of our participants! In the past, some of our Maryland participants opted in to collect samples for pesticide residue analysis from their apiaries. Those efforts were funded by the Maryland Department of Agriculture for Maryland apiaries.
Due to the strong interest indicated by past Sentinel participants to understand the potential pesticide risk levels their colonies are experiencing, we reorganized the program this year to provide insight into this aspect of honey bee health.
Given the high cost associated with pesticide testing, material to collect one composite bee bread sample per apiary is included per Sentinel kit. These samples will be processed by the Chemical Ecology Core Facility at Cornell University. In addition to receiving the raw residue level results, we will, as usual, do our best to also provide additional context to help interpret what your pesticide results could mean for your bees. This means we will provide you with the toxicological information known about the compounds found in your sample, including each compound’s mode of action, potential sources, and LD50 (i.e., the dose that causes the death of 50% of the population). We will also include the measure of risk, known as the Hazard Quotient (HQ), which assesses risk level by comparing observed residue levels with both the pesticide’s known toxicity, as well as a with national levels observed by the USDA APHIS National Honey Bee Disease Survey.
We hope this snapshot into the pesticide exposure your Sentinel colonies are experiencing will help paint a clearer picture of the residues that can impact the health of our bees. Furthermore, it will also provide a sense of the diversity and concentration of contamination present in the environment that bees are so good at sampling. By knowing the potential sources and the nature of contaminants, we hope this will encourage more discussion around the safe use of pesticides between beekeepers and those around us.
Nosema Trends
Nosema remains an important honey bee disease, and we will continue our work monitoring the observed trends in Sentinel apiary Nosema loads. However, one of the limitations with Nosema data is the absence of a clearly effective and safe treatment option, which renders Nosema load data hard to make actionable! We therefore decided that for 2022 we would reduce the number of Nosema samples analyzed from six to two. But the decision about when to collect samples for Nosema analysis is a direct result of past Sentinel Program data.
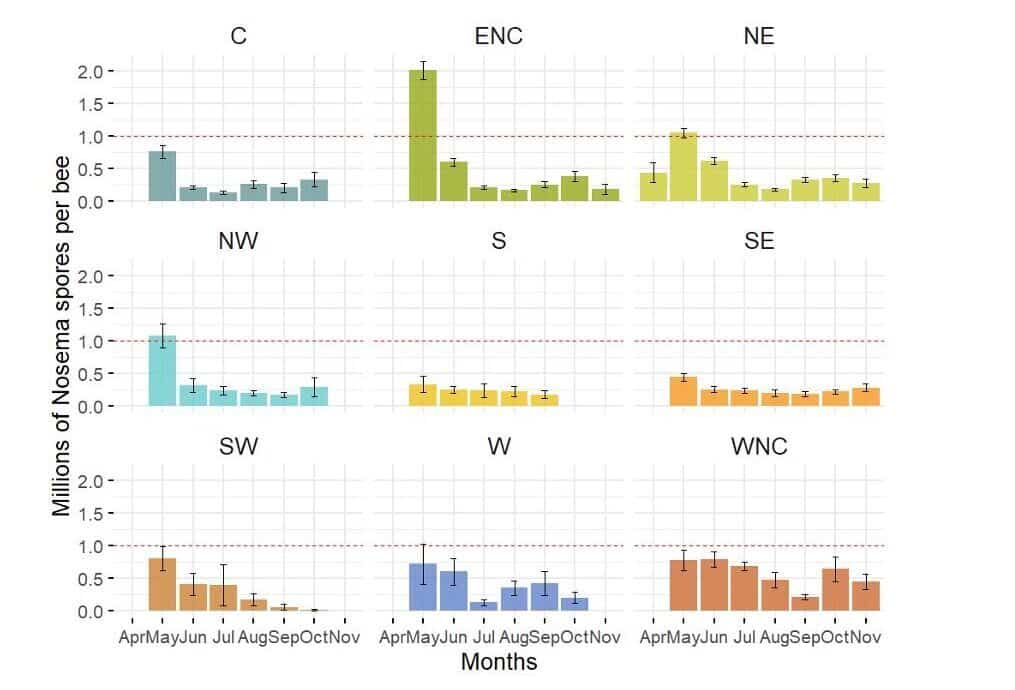
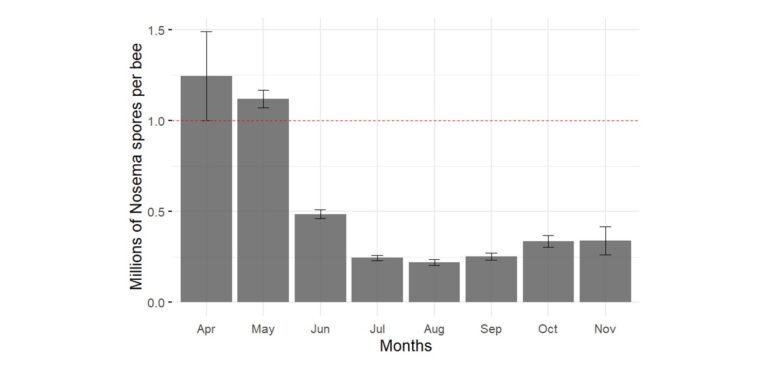
We have been collecting Nosema prevalence and load data since the early years of the program, beginning in 2013. Analyzing the data from these many samples collected over nearly a decade has taught us that Nosema infections exhibit a very consistent, annual cycle, with loads peaking early in the season and naturally dropping soon after (Figure 1).
We therefore strategically placed our two Nosema Sentinel sampling periods at the beginning and middle of the season. By taking one sample at peak Nosema season, and a second collected after the expected drop in Nosema loads, we hope to confirm those trends, while still identifying colonies with concerning levels, and those that fail to return to acceptable levels by the second sampling point. Though the association between high Nosema load and colony mortality is still uncertain in the scientific literature, there are indications that Nosemosis could be associated with poor performance, such as delayed colony growth or poor honey production. These are just some of the many hypotheses that the data generated through your Sentinel Program participation can help us put to the test.
We look forward to delving into the world of pesticide data and analysis with you, and thank you for joining us this year!