It’s the end of another honey bee season – and as the little gals are hunkering down, bracing for the cold winds of winter, our lab technicians are getting to work compiling data and publishing reports. Also coming with the end of the season is the close of our second official year of a project called Tier 4, or Real Time Disease Load Monitoring. This project provides colony health information to commercial, sideline and small-scale beekeepers. This year, fifteen of our Tier 4 participants collaborated with us on the Pollen Trap Collection Pilot study. The purpose of the pollen trap project is to give beekeepers an idea of what flowers their bees are visiting at different points in the season and the quantity of pollen being brought back to the colony. The nutritional value of pollen varies depending on pollen type, and there are few if any flowers that can provide honey bees with all the nutrition they need. In general, floral and pollen diversity means greater nutritional diversity and healthier hives.
The Bee Informed Partnership is celebrating the close of the pollen trap pilot project with a pollen sorting and data reorganization party. Twice a month, from May to September, beekeepers placed pollen traps on Tier 4 Real-Time Disease Load Monitoring hives, and sent collected pollen samples to our lab here at the University of Maryland, College Park. We’re sorting the pollen from each sample into subsamples based on color and comparing the weight of each subsample to the total, giving us the relative quantity of each pollen type. After sorting, each subsample of pollen is placed in separate vials for future analysis.
So what do we do with the pollen when samples arrive in the lab?
Beekeepers take samples approximately around the first and 15th of the month, collecting trapped pollen in 50 mL vials and sending them with collected bee disease load monitoring samples. We label and store pollen samples in a freezer until it’s time for processing. Processing simply means separating the pollen based on color, finding the relative weight of each color type, and separating pollen types for possible further analysis.
Our basic procedure:
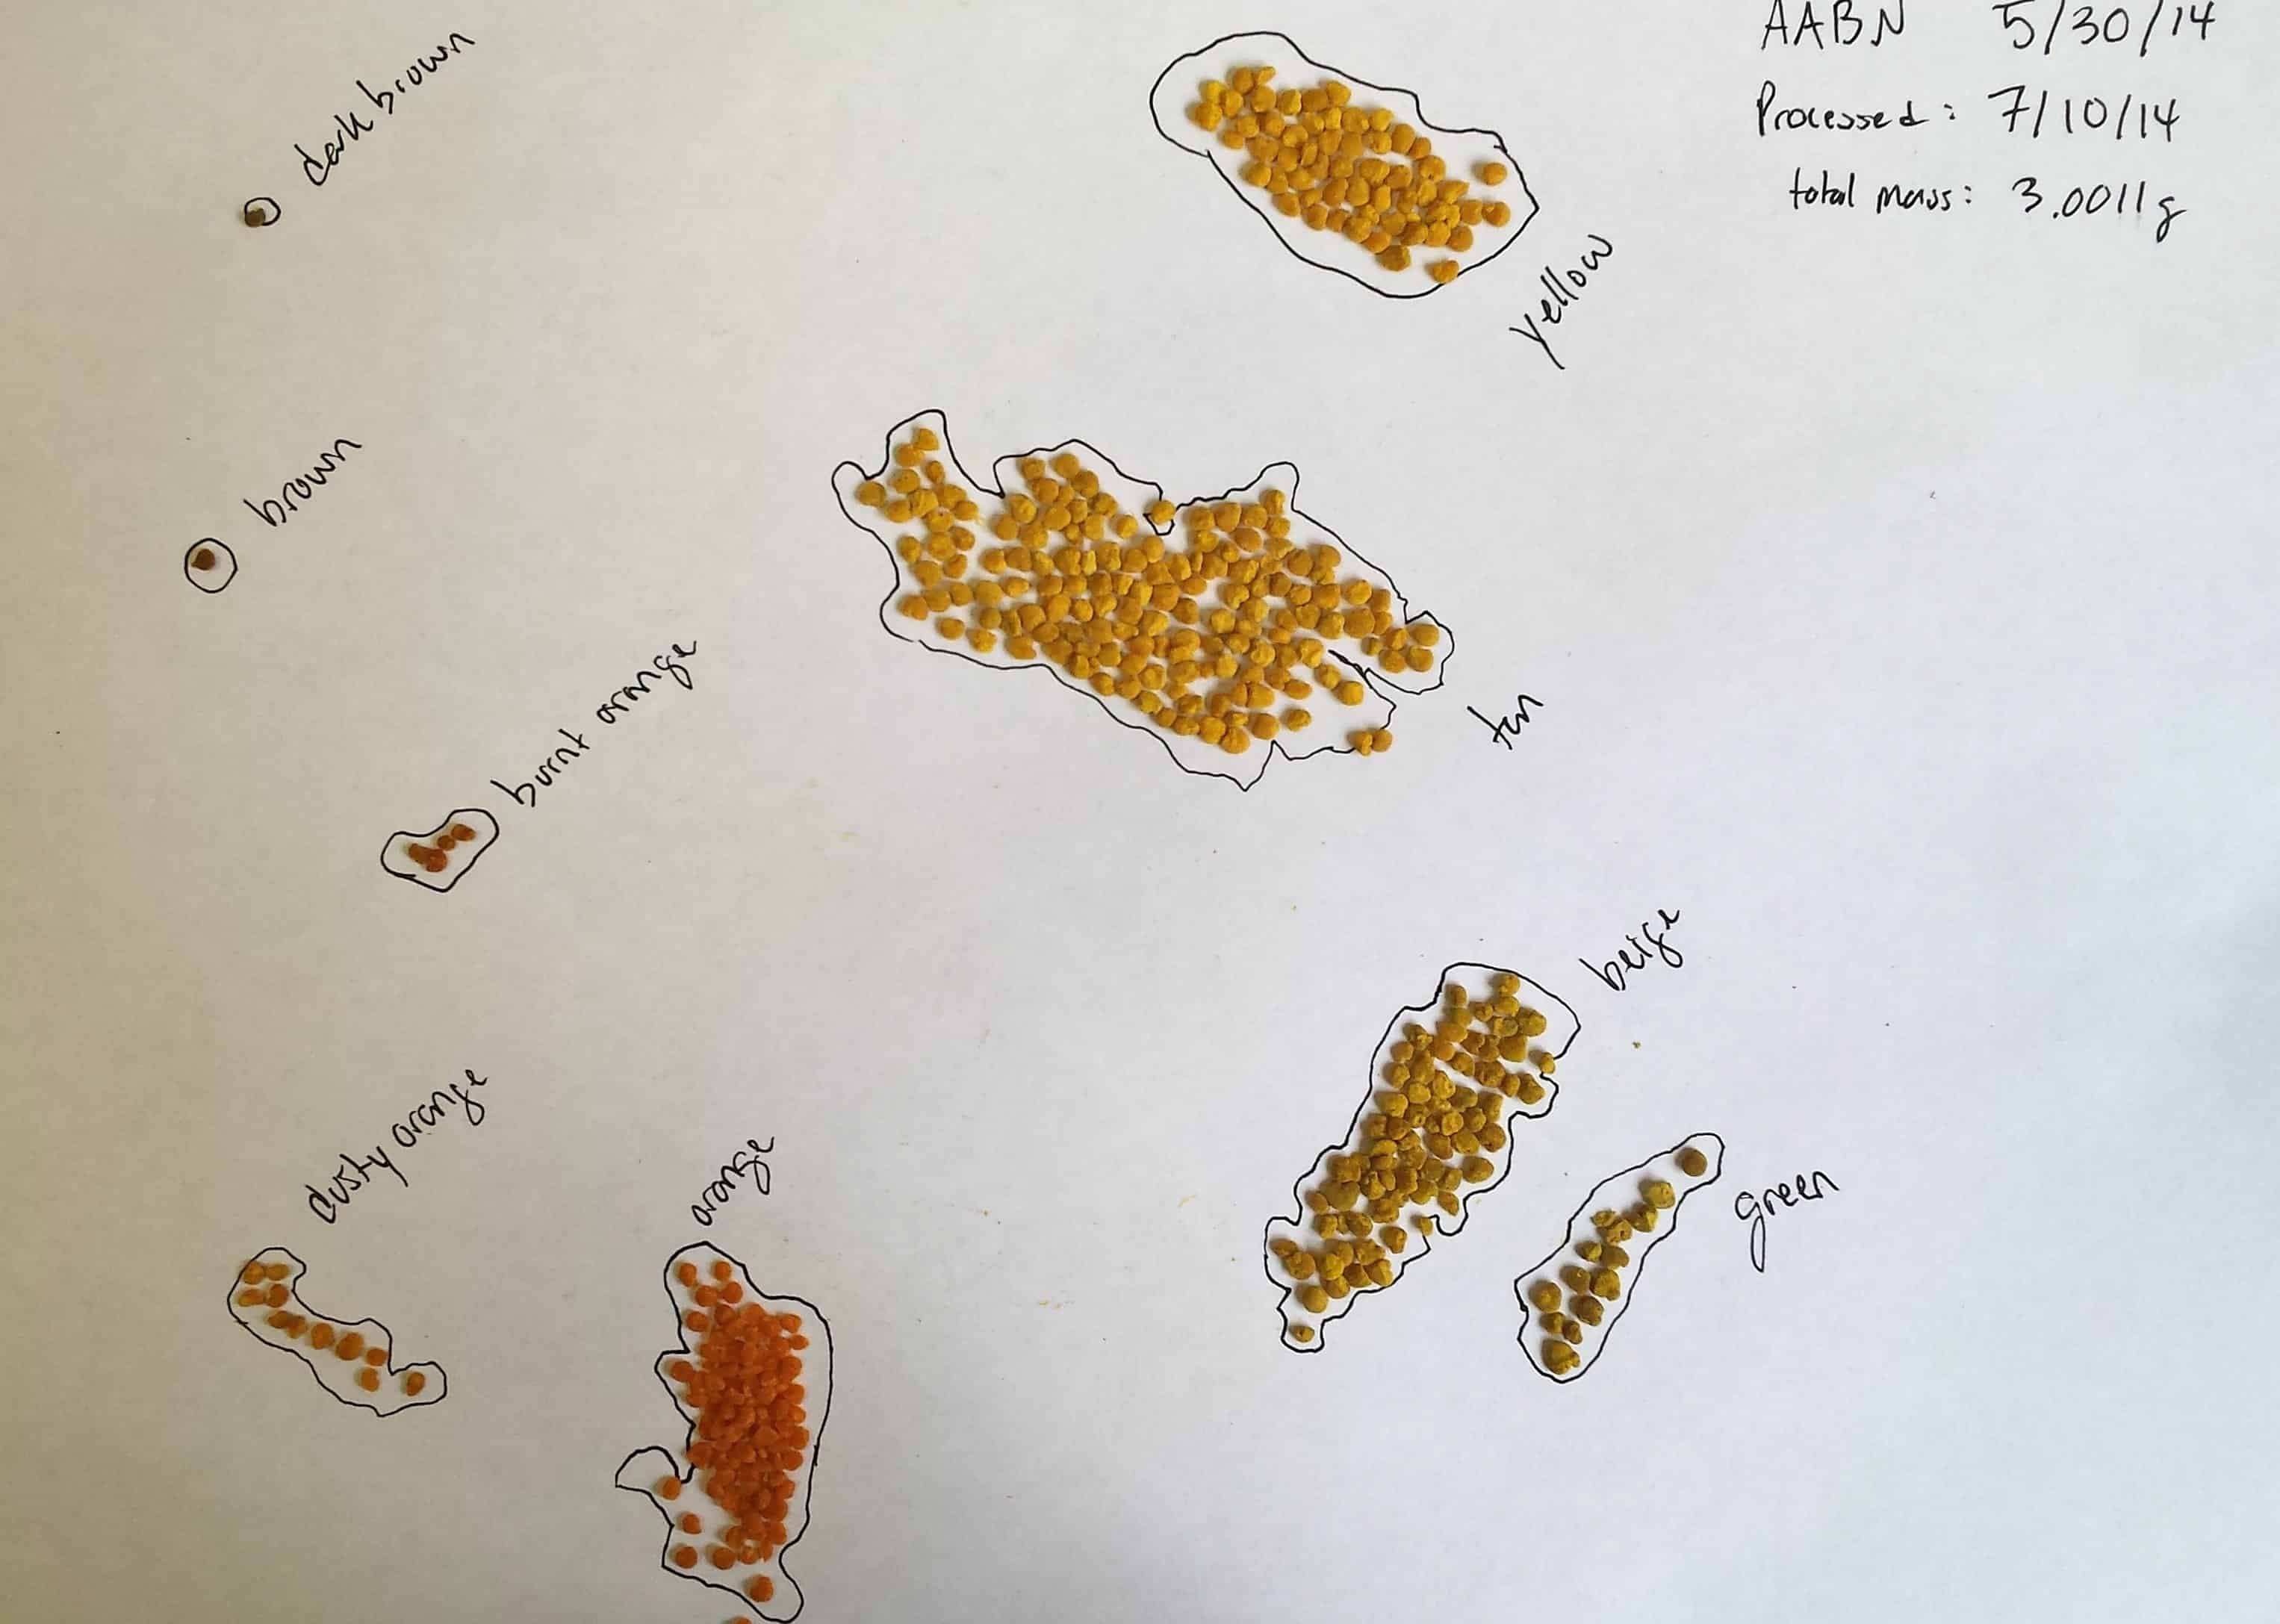
- We first record the beekeeper and trap number, sample date, and process date.
- Then we weigh the entire sample, keeping out roughly 3 grams for analysis and returning the remainder to the vial.
- Next we separate the pollen by color. This can take anywhere from 30 minutes to over an hour per sample. This depends on the number and diversity of the pollen and the contrast between pollen types. Moisture in the sample can make the colors bleed into each other and make it difficult to tell one color from another. You can imagine that the goop from a rain-soaked pollen sample is quite difficult (and sometimes impossible) to sort.
- Next we color code pollen types for each beekeeper and place piles of sorted pollen in centrifugation tubes for future analysis.
If we only had a dollar for every cell in our excel spreadsheet generated from the pollen data, I’ll tell you what! So what can we do with all that data? Well, first of all, we can gain insight into the nutritional diversity of the colony’s diet. Nutritional diversity can be estimated from the number and relative abundance of each pollen type. Relative abundance is based on the weight of pellets sorted within the 3g sample of each color. Of each 3g sample the total weight of a single color will fall between the boundaries of what is considered Abundant, Rare, and Very Rare. This information will be provided to each beekeeper in an end-of-year report coming soon. From this information, beekeepers can gain a better understanding of the foraging behavior of their hives and compare their results to other beekeepers and apiaries in the region. Beekeepers can also make inferences about how well their bees prepared for overwintering and then decide whether or not to provide additional nourishment. Additionally, the results from the project may show whether or not there is a correlation between foraging behaviors and honey bee disease, by matching and comparing the data collected from the pollen project to the disease monitoring data. The next step is to identify the species of pollen and conduct pesticide analysis. Since this was a pilot project, these next steps will be implemented in the future.