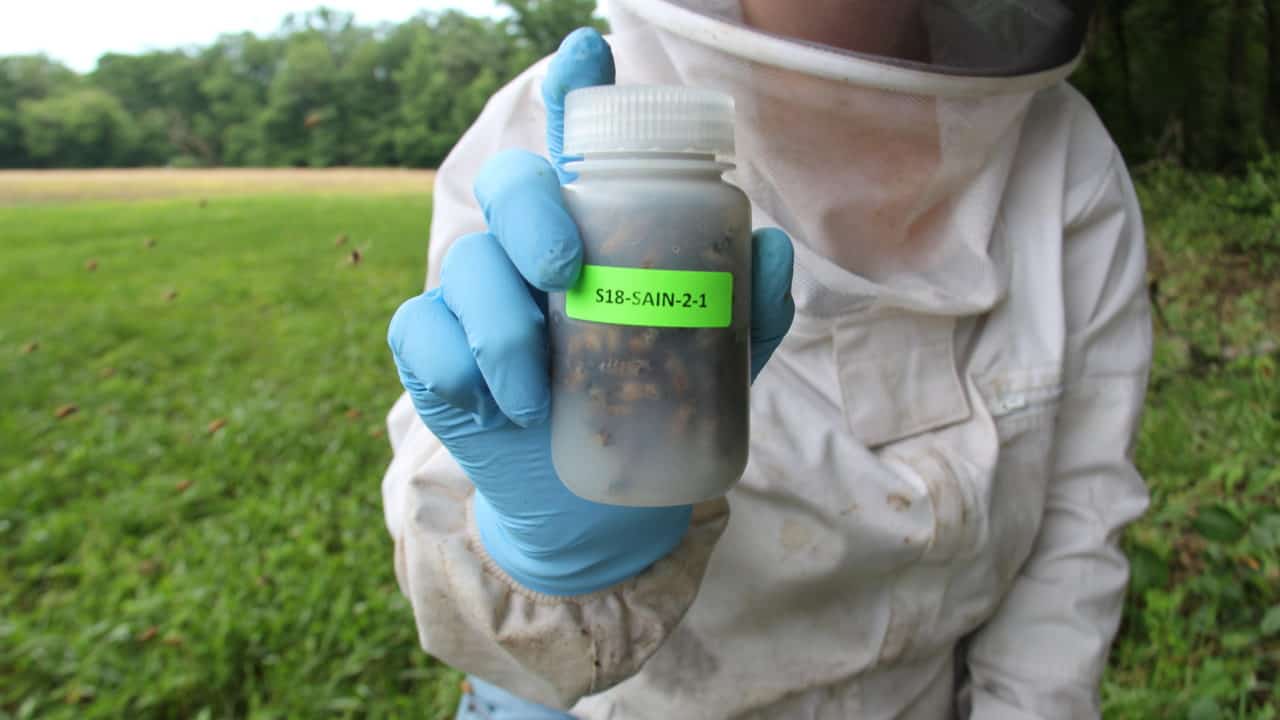
That’s a wrap on the 2019 Sentinel Apiary Program! This year was a real record breaker with 106 Sentinel Apiaries in 29 states. Sentinel beekeepers put in blood, sweat, and stings to send in over 2,500 samples from 564 colonies. The data collected from these samples helps participants make data driven management decisions. Mite loads are also shared on our public interactive Varroa map, so that Sentinel Apiaries can act as regional benchmarks for colony health. If you would like to help support the Sentinel Apiary program and keep this valuable data accessible, please consider donating to our annual fundraising effort!
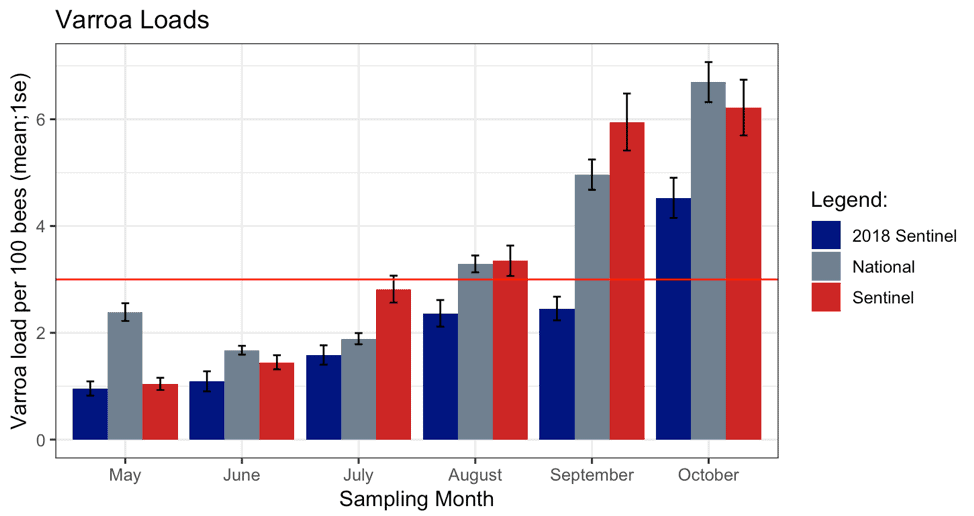
On average, this year’s Sentinel apiary Varroa loads were similar to the national average each month. They were also significantly higher than last year’s Sentinel mite loads. It will be interesting to see if this is reflected in winter mortality. Check out our interactive Varroa map to see how mite loads differed between states.
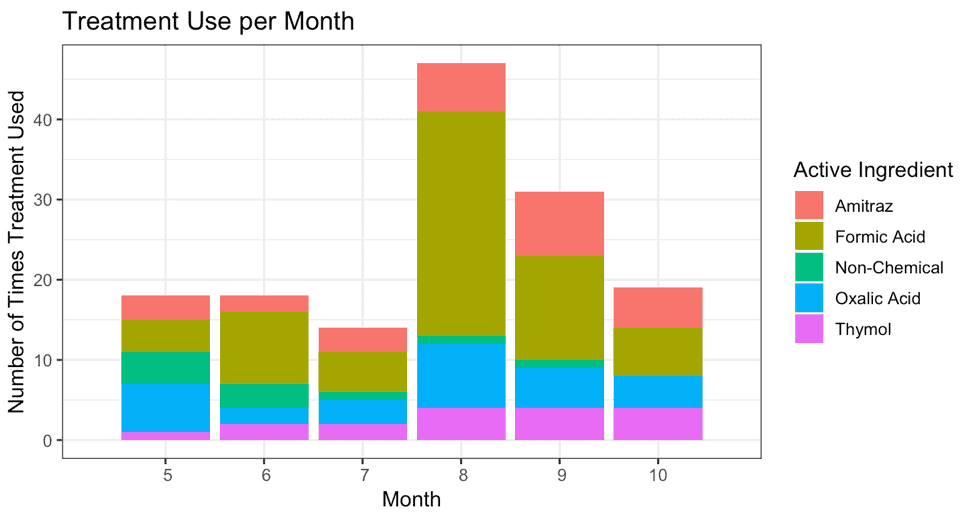
Sentinel helps take the guesswork out of when to treat, and whether treatments were effective. Since there was higher mite pressure this year, let’s take a look at what beekeepers were using for control methods. August and September were the most popular months to treat for mites. The most popular treatment of the year was Formic Acid with 65 reported uses. Formic Pro gained in popularity significantly, accounting for 39 of these Formic Acid uses (the other 26 of these were MAQS.). Oxalic Acid (28 uses) and Amitraz (27 uses) were the next most commonly used products.
View the graph below to see how often the top 4 reported chemicals, as well as non-chemical methods, were used over the season. Other reported chemicals included Fluvalinate (n = 5), Coumaphos (n = 5), and Hop oils (n = 5). Non-chemical methods included brood breaks (n = 5), drone brood removal (n = 3), and powdered sugar (n = 1).
As for our superlatives, here’s who’s takes the trophy for the whole year in each category:
This year, the state with the most Sentinel Apiaries and samples was Michigan with a whopping 405 samples from 14 apiaries.
Michigan also sent in the most drones total, with 1,544 drones. But New York had the most drones per sample by a mile, with 11.2 drones per sample.
Minnesota consistently had the lowest Varroa loads, with a yearly average of only 0.9 mites/100 bees. Great job MN!
Finally, if you’ve been following along it’s no surprise that Illinois had the year’s biggest bees, with an average of 0.18 grams per bee.
If you found this blog interesting, we will publish our annual Sentinel End of Year Report in the coming weeks with more information like this, so stay tuned! In the meantime, you can view last year’s here.
Finally, our annual fundraiser is in full swing, and your donation will go to helping programs like Sentinel stay affordable for fellow beekeepers. Please consider donating to this valuable data collection effort!