
Hello beekeepers, it is hard to believe it is almost the end of the 2020 Sentinel season already!
We had a little sabbatical from our Sentinel blogging this year because so much has been going on, but we are back! There are many exciting things on their way for the Sentinel Apiaries program, and I cannot wait to start sharing them with you over the next few months. In the meantime, here is a little sneak peek of what’s to come.
Before I delve into tidbits from this year, I want to let you know about the Sentinel app that our fantastic IT team is finishing up as I write this. This app will allow interested Sentinel participants to log into an individual account and directly enter their inspection notes in the app while they are in the colony! We will also release a dashboard that will allow participants to see all their current and previous data in one place online. When you log in, your data will be ready.
This year, Sentinel participation has been great as usual. We have received an average of 322 samples from 69 apiaries each month between May and September, peaking in June with 363 samples from 76 unique apiaries. September had our lowest number of samples, with 267 from 60 apiaries.
If you have not inspected or sampled your colonies yet, make sure you do so now (weather permitting). We want your Varroa loads as low as possible as we begin the overwintering process, and the first step to getting the upper hand on Varroa is monitoring.
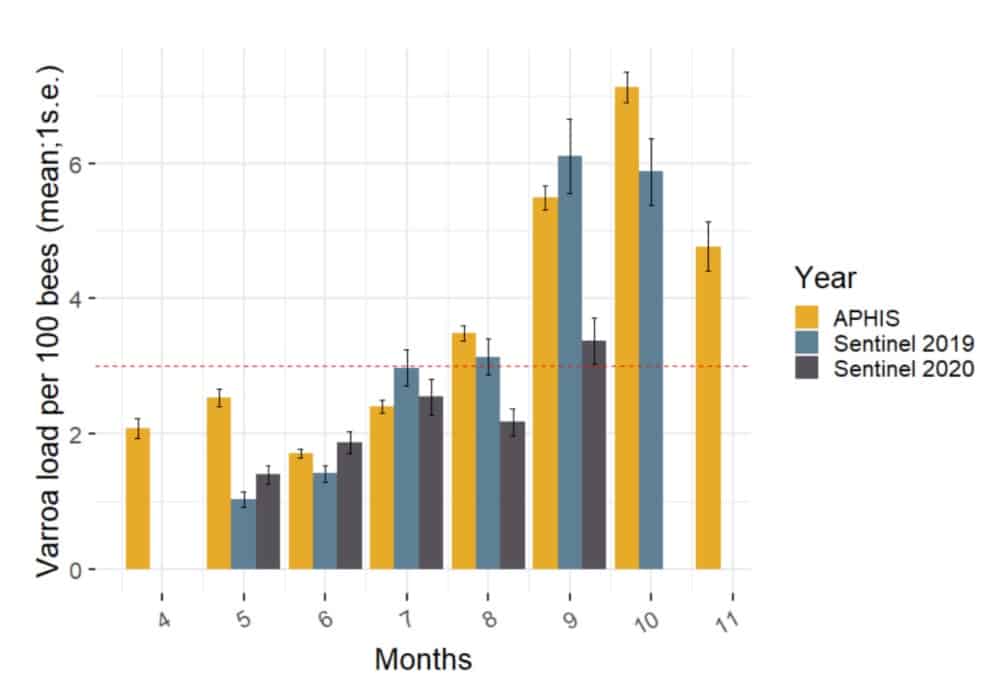
From May to August this year, the average Varroa load for Sentinel participants has remained below our treatment threshold of 3 mites per 100 bees. September brought the average above that threshold as it always has, but just barely—and much lower than last year, as well as compared to the NHBS average. We love to see it!
Mite loads were higher in the beginning of the season this year than last year, but they did not increase as drastically this year as we got into the summer. Unlike last year, we saw a drop in mite counts from July to August.
Check back next month for a final (and complete) overview of this year’s Sentinel season!