By Selina Bruckner, Geoff Williams, Nathalie Steinhauer
The Bee Informed Partnership Colony Loss and Management Survey month is almost over – time flies when you’re having fun preventing swarming, installing packages, and adding your supers! Have you taken the survey yet? If not, don’t miss out on even more fun! This year’s survey is the shortest it’s ever been! Take the survey here.
Time also flies in terms of the years that the BIP survey has been conducted; it is celebrating its 15th birthday! The survey has come a long way since 2006. Here, we review some of the survey’s outputs so far.
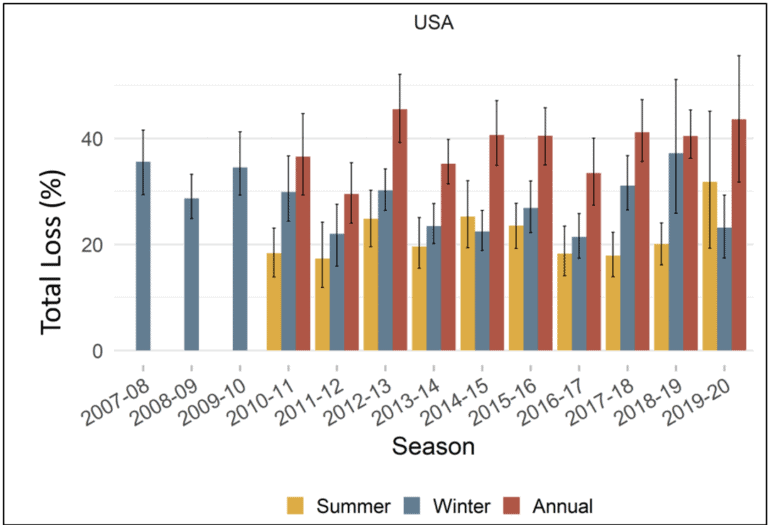
In total, ten scientific articles documenting national colony losses in the United States have been published. Those publications are based on data that represent one of the largest collections of longitudinal honey bee colony loss data on the planet! Although the initial focus of the survey was to document winter losses, the survey has also been collecting information about summer losses since 2010. By doing so, we have seen that loss rates vary among seasons and years (Figure 1).
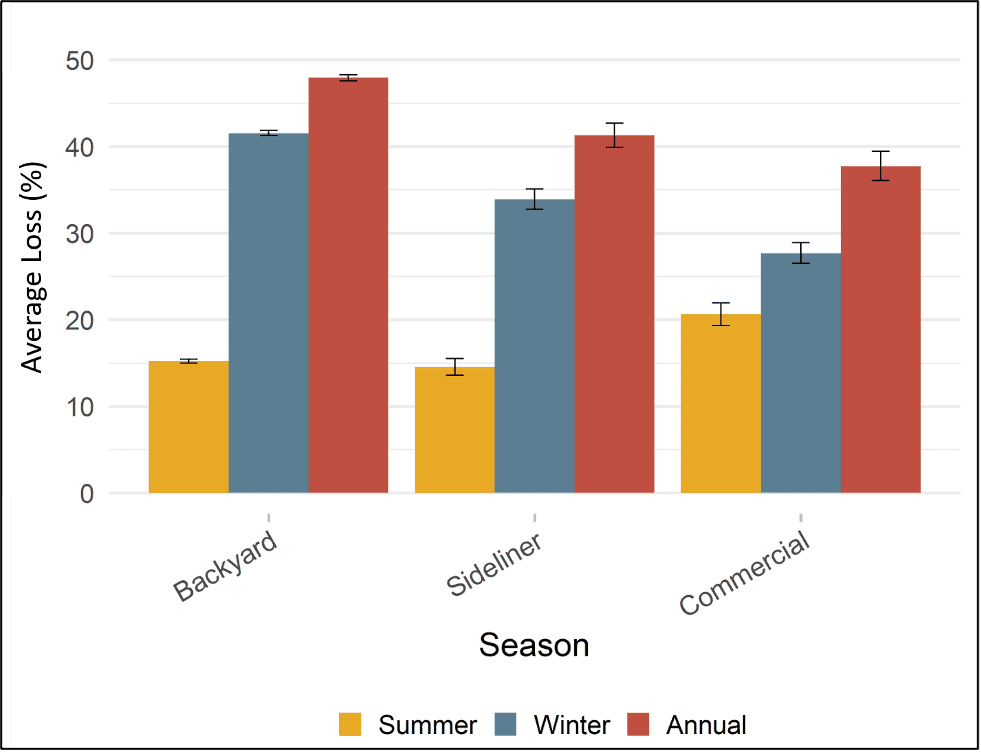
Not only that, but loss rates are also different for operations of different sizes. We differentiate among backyard beekeepers who manage 50 or less colonies, sideline (managing 51-500 colonies) and commercial beekeepers (managing 500+ colonies). Most of our survey participants are backyard beekeepers who generally experience the highest losses during the winter. Commercial beekeepers represent a small number of participants but own the vast majority of the colonies, and tend to lose colonies more evenly between summer and winter (Figure 2).
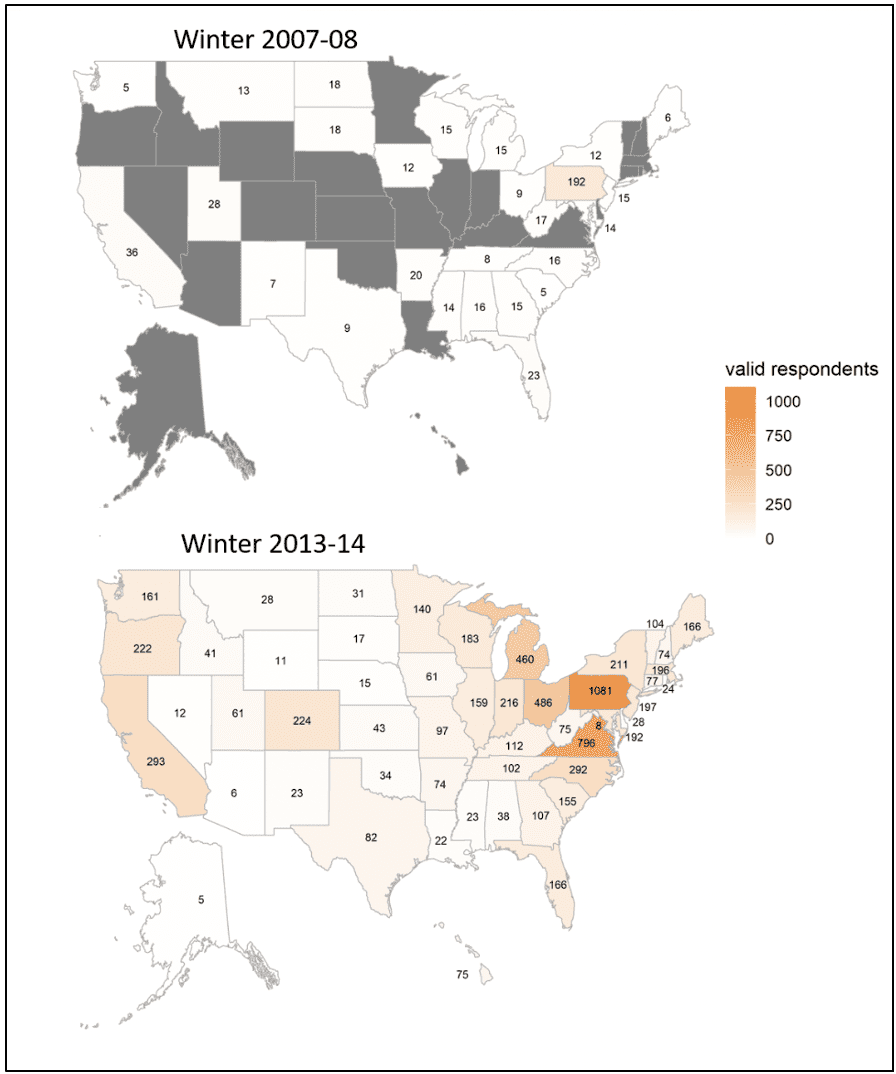
Recruiting beekeepers to generate this sort of data is not as easy as one would think. In the early days of the survey, it was exclusively conducted over the phone which involved many talking minutes and restricted the number of beekeepers that could be interviewed. Therefore, an online survey was developed in 2009 to reach more beekeepers from all over the country. Efficient advertising in addition to different survey formats indeed increased the reach of the survey from 384 respondents in 2006 to a maximum of 7,535 in 2015 Similarly, survey respondents came from 23 of the 50 U.S. states in 2007, whereas beekeepers from every state answered the survey in 2013-14 (Figure 3). We really appreciate everyone that helps to distribute our survey each year via their networks!
As a previous participant, you probably noticed that we only talked about the “Colony Loss” part so far. However, recent surveys actually consisted of three parts – “Colony Loss”, “Management” and “Socio-Economics”.
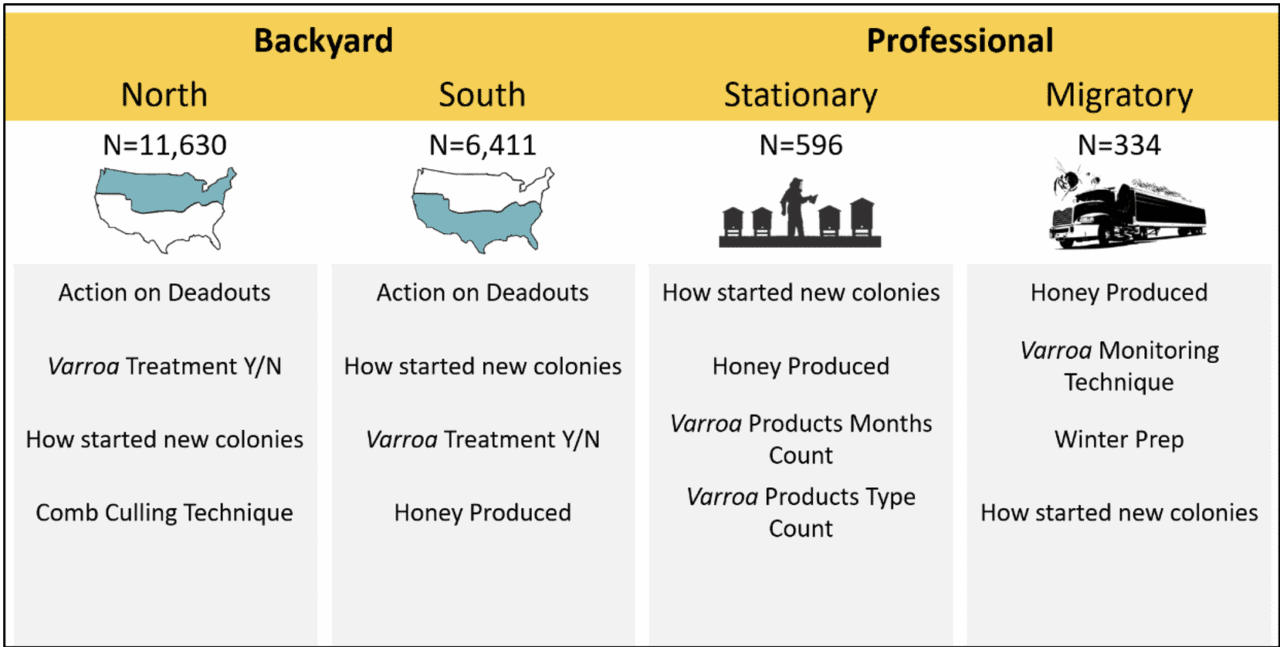
These additional sections have given us valuable insights. For example, the information was used to rank different management practices for different groups and regions (Figure 4 ) according to the highest expected reduction in colony loss if adopted by more beekeepers.
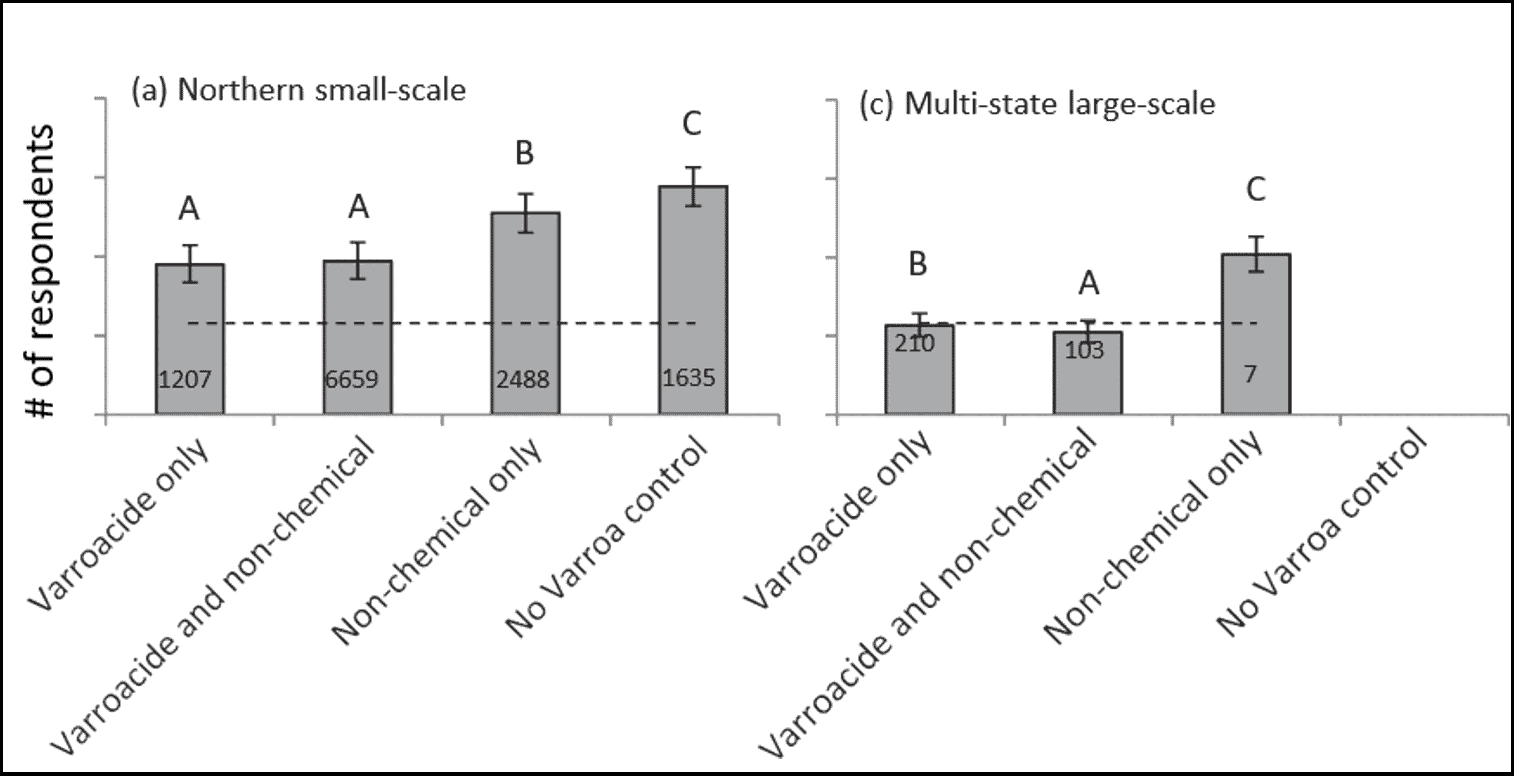
Management practices employed and reported in the survey vary regionally and by operation size and beekeeper philosophy, especially in the area of Varroa management. It turns out there are some ‘treatment sceptics’ and ‘treatment adherents’ among us, according to a study by Thoms et al. (2019), which employed survey data. Large-scale operations consistently use synthetic control methods, whereas small-scale operations are more likely to apply a broader range of treatments including non-chemical interventions (Figure 5).
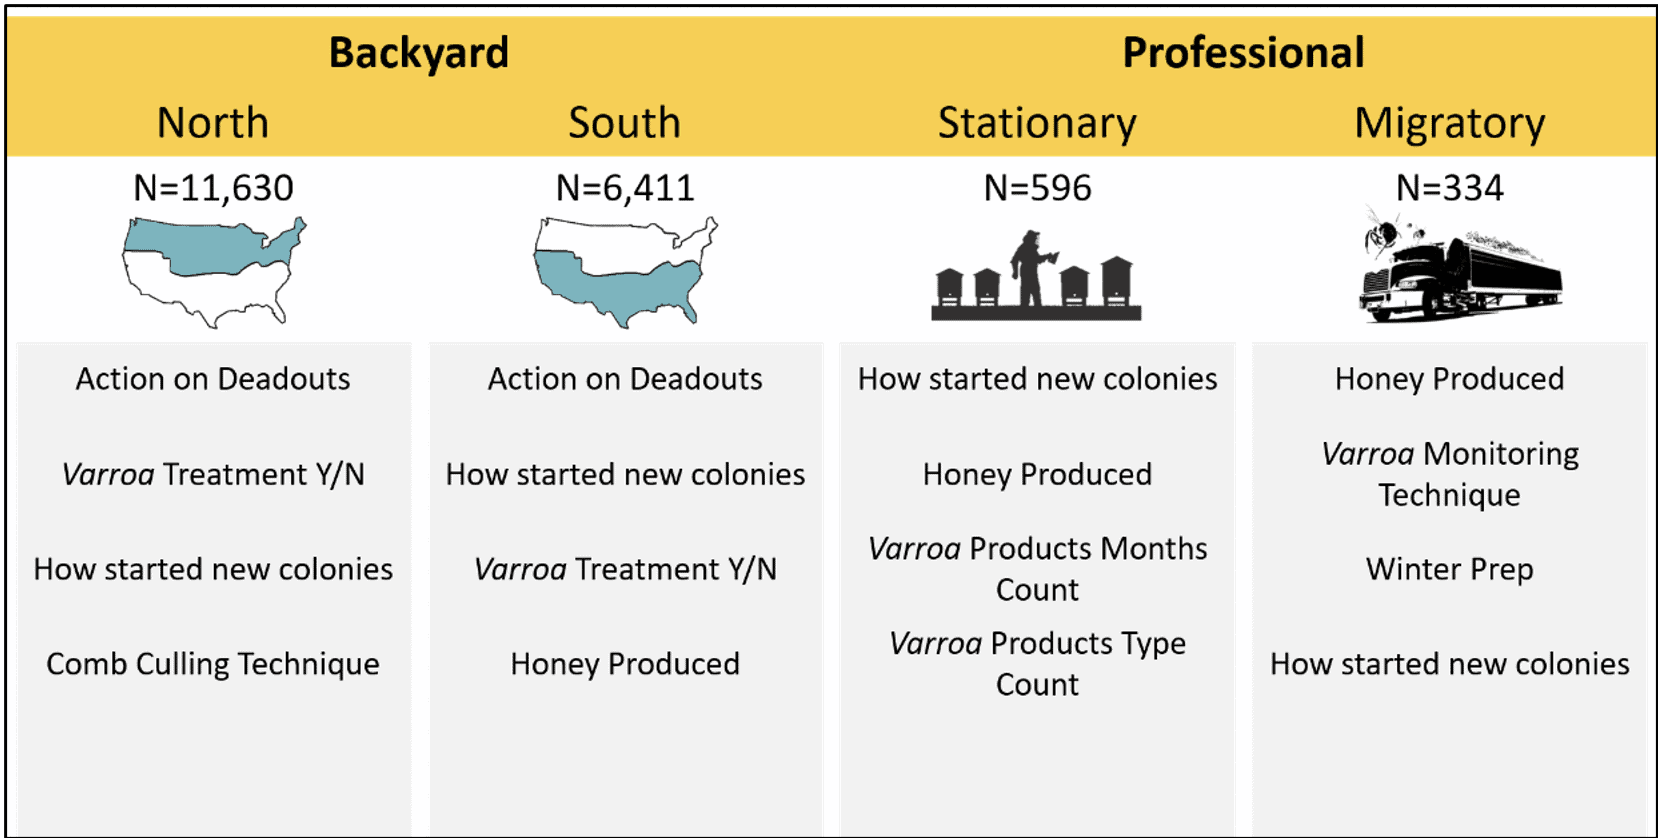
Most recently, we have made a big effort to address beekeeper feedback and make the survey shorter than ever before! Instead of tackling all management aspects at once, we decided to focus on one specific topic each year. As mentioned earlier, professional large-scale beekeepers tend to manage their hives differently than small-scale operations. Therefore, our team has developed a tailored survey version to better capture their information, as described in the previous survey-related blog post.
If you want to delve deeper in our past results, head over to the data explorer on the Bee Informed Partnership webpage. You can compare specific loss numbers (of your home state) over the years, see how different management practices and much more.
And in case you would like to contribute to this large collection of data, please take the survey or share the link with your peers. There are only a few days left!
Take the survey here
