The Bee Informed Partnership has released preliminary state losses for 2016-2017. If there are fewer than 5 respondents in a state, we will not release those numbers to preserve confidentiality. These tables represent Annual loss, Winter Loss and Summer Loss. We also report Total Loss and Average Loss.
For further details regarding the difference between Total and Average loss, please read on. The Bee Informed Partnership traditionally reports total loss, or a weighted loss rate. Total loss treats each colony the same or more simply stated, “One colony one vote.” This means that the total loss rate is more representative of commercial beekeeper loss as they manage a large majority of the colonies in the survey. The average loss rate, which we no longer report in our preliminary summary, is an unweighted rate where we calculate the loss rate for each responding beekeeper and average these rates. So average loss, more simply stated is, “One beekeeper, one vote.” As there are many more backyard beekeepers than commercial beekeepers, average loss rates are more influenced by these smaller beekeepers.
The Figure provide a heat map of Annual Total losses by state and in the tables below, N represents the number of beekeepers from that state answering those survey questions.
Figure 1: 2016-2017 Total Annual Loss by State
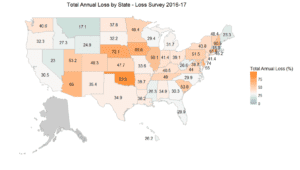
Table 1: 2016-2017 Annual Loss by State or Territory:
| Season | State | N | Total Loss | Average Loss |
| ANNUAL | Alabama | 38 | 34.90 | 42.70 |
| ANNUAL | Alaska | 0 | NA | NA |
| ANNUAL | Arizona | 10 | 64.96 | 34.05 |
| ANNUAL | Arkansas | 32 | 39.74 | 34.38 |
| ANNUAL | California | 160 | 30.52 | 35.69 |
| ANNUAL | Colorado | 90 | 48.28 | 51.78 |
| ANNUAL | Connecticut | 34 | 61.83 | 53.89 |
| ANNUAL | District of Columbia | 20 | 38.68 | 54.86 |
| ANNUAL | Delaware | 38 | 74.03 | 59.97 |
| ANNUAL | Florida | 60 | 28.89 | 42.20 |
| ANNUAL | Georgia | 79 | 30.32 | 47.85 |
| ANNUAL | Hawaii | 10 | 26.19 | 26.39 |
| ANNUAL | Idaho | 30 | 27.27 | 54.35 |
| ANNUAL | Illinois | 94 | 59.05 | 60.53 |
| ANNUAL | Indiana | 99 | 41.39 | 40.87 |
| ANNUAL | Iowa | 71 | 68.62 | 47.57 |
| ANNUAL | Kansas | 16 | 47.69 | 36.67 |
| ANNUAL | Kentucky | 50 | 40.52 | 38.18 |
| ANNUAL | Louisiana | 17 | 36.21 | 37.16 |
| ANNUAL | Maine | 65 | 23.26 | 57.22 |
| ANNUAL | Maryland | 127 | 54.96 | 48.61 |
| ANNUAL | Massachusetts | 86 | 15.88 | 52.10 |
| ANNUAL | Michigan | 136 | 31.74 | 61.45 |
| ANNUAL | Minnesota | 79 | 49.39 | 56.57 |
| ANNUAL | Mississippi | 9 | 26.28 | 43.33 |
| ANNUAL | Missouri | 88 | 33.64 | 36.12 |
| ANNUAL | Montana | 21 | 17.08 | 44.24 |
| ANNUAL | Nebraska | 15 | 72.11 | 67.14 |
| ANNUAL | Nevada | 13 | 22.97 | 63.11 |
| ANNUAL | New Hampshire | 48 | 60.53 | 67.12 |
| ANNUAL | New Jersey | 74 | 41.44 | 44.51 |
| ANNUAL | New Mexico | 19 | 35.38 | 60.97 |
| ANNUAL | New York | 142 | 43.78 | 53.61 |
| ANNUAL | North Carolina | 205 | 29.88 | 41.82 |
| ANNUAL | North Dakota | 17 | 37.79 | 48.91 |
| ANNUAL | Ohio | 233 | 39.05 | 48.47 |
| ANNUAL | Oklahoma | 28 | 83.90 | 26.20 |
| ANNUAL | Oregon | 136 | 32.32 | 50.98 |
| ANNUAL | Pennsylvania | 580 | 51.54 | 61.95 |
| ANNUAL | Puerto Rico | 0 | NA | NA |
| ANNUAL | Rhode Island | 14 | 45.21 | 55.97 |
| ANNUAL | South Carolina | 53 | 53.78 | 38.93 |
| ANNUAL | South Dakota | 12 | 32.16 | 39.74 |
| ANNUAL | Tennessee | 57 | 49.04 | 39.11 |
| ANNUAL | Texas | 136 | 34.86 | 26.43 |
| ANNUAL | Utah | 167 | 53.24 | 66.51 |
| ANNUAL | Vermont | 42 | 48.41 | 59.89 |
| ANNUAL | Virginia | 370 | 44.05 | 42.51 |
| ANNUAL | Washington | 88 | 40.59 | 52.72 |
| ANNUAL | West Virginia | 51 | 26.56 | 31.91 |
| ANNUAL | Wisconsin | 99 | 29.42 | 61.43 |
| ANNUAL | Wyoming | 17 | 24.83 | 46.99 |
| ANNUAL | MultiStateOperation | 121 | 31.81 | 44.89 |
Table 2: 2016-2017 Winter Loss by State or Territory:
| Season | State | N | Total Loss | Average Loss |
| WINTER | Alabama | 43 | 25.19 | 32.88 |
| WINTER | Alaska | 2 | 100.00 | 100.00 |
| WINTER | Arizona | 10 | 61.86 | 24.09 |
| WINTER | Arkansas | 39 | 17.43 | 19.60 |
| WINTER | California | 180 | 17.98 | 29.64 |
| WINTER | Colorado | 131 | 36.18 | 47.97 |
| WINTER | Connecticut | 44 | 54.86 | 49.83 |
| WINTER | District of Columbia | 25 | 38.89 | 55.12 |
| WINTER | Delaware | 46 | 68.99 | 51.20 |
| WINTER | Florida | 65 | 18.99 | 28.42 |
| WINTER | Georgia | 85 | 12.85 | 35.05 |
| WINTER | Hawaii | 10 | 26.19 | 26.39 |
| WINTER | Idaho | 40 | 12.79 | 54.78 |
| WINTER | Illinois | 121 | 53.96 | 56.64 |
| WINTER | Indiana | 119 | 22.98 | 33.56 |
| WINTER | Iowa | 85 | 46.58 | 39.42 |
| WINTER | Kansas | 24 | 39.85 | 35.72 |
| WINTER | Kentucky | 53 | 17.60 | 30.06 |
| WINTER | Louisiana | 23 | 32.43 | 28.99 |
| WINTER | Maine | 85 | 16.30 | 53.38 |
| WINTER | Maryland | 162 | 41.62 | 41.88 |
| WINTER | Massachusetts | 112 | 15.72 | 50.23 |
| WINTER | Michigan | 174 | 18.58 | 59.49 |
| WINTER | Minnesota | 107 | 22.49 | 53.38 |
| WINTER | Mississippi | 9 | 6.62 | 15.28 |
| WINTER | Missouri | 113 | 24.14 | 28.91 |
| WINTER | Montana | 28 | 10.55 | 38.51 |
| WINTER | Nebraska | 22 | 56.72 | 62.33 |
| WINTER | Nevada | 15 | 7.27 | 45.90 |
| WINTER | New Hampshire | 58 | 54.24 | 59.29 |
| WINTER | New Jersey | 83 | 17.56 | 38.19 |
| WINTER | New Mexico | 25 | 37.82 | 58.18 |
| WINTER | New York | 168 | 25.01 | 46.85 |
| WINTER | North Carolina | 230 | 15.33 | 30.91 |
| WINTER | North Dakota | 21 | 22.09 | 44.54 |
| WINTER | Ohio | 284 | 31.51 | 42.00 |
| WINTER | Oklahoma | 33 | 43.61 | 12.14 |
| WINTER | Oregon | 169 | 20.46 | 44.40 |
| WINTER | Pennsylvania | 753 | 39.94 | 58.02 |
| WINTER | Puerto Rico | 0 | NA | NA |
| WINTER | Rhode Island | 18 | 36.62 | 47.95 |
| WINTER | South Carolina | 57 | 32.84 | 29.83 |
| WINTER | South Dakota | 13 | 24.54 | 35.81 |
| WINTER | Tennessee | 66 | 25.29 | 28.68 |
| WINTER | Texas | 146 | 16.46 | 17.16 |
| WINTER | Utah | 232 | 45.22 | 66.60 |
| WINTER | Vermont | 51 | 37.67 | 55.73 |
| WINTER | Virginia | 443 | 35.92 | 35.38 |
| WINTER | Washington | 112 | 28.86 | 47.23 |
| WINTER | West Virginia | 58 | 16.41 | 21.42 |
| WINTER | Wisconsin | 140 | 18.77 | 55.54 |
| WINTER | Wyoming | 19 | 23.64 | 34.94 |
| WINTER | MultiStateOperation | 134 | 18.75 | 34.76 |
Table 3: 2016-2017 Summer Loss by State or Territory:
| Season | State | N | Total Loss | Average Loss |
| SUMMER | Alabama | 44 | 16.07 | 23.91 |
| SUMMER | Alaska | 0 | NA | NA |
| SUMMER | Arizona | 11 | 8.67 | 22.80 |
| SUMMER | Arkansas | 36 | 36.24 | 21.97 |
| SUMMER | California | 169 | 17.52 | 18.90 |
| SUMMER | Colorado | 96 | 26.65 | 15.87 |
| SUMMER | Connecticut | 38 | 16.08 | 21.95 |
| SUMMER | District of Columbia | 23 | 14.41 | 15.51 |
| SUMMER | Delaware | 39 | 19.34 | 17.39 |
| SUMMER | Florida | 71 | 13.97 | 25.97 |
| SUMMER | Georgia | 84 | 23.07 | 21.40 |
| SUMMER | Hawaii | 10 | 0.00 | 0.00 |
| SUMMER | Idaho | 30 | 19.94 | 13.04 |
| SUMMER | Illinois | 98 | 18.40 | 18.33 |
| SUMMER | Indiana | 102 | 13.10 | 12.49 |
| SUMMER | Iowa | 72 | 58.36 | 12.43 |
| SUMMER | Kansas | 18 | 15.00 | 26.03 |
| SUMMER | Kentucky | 58 | 38.08 | 20.83 |
| SUMMER | Louisiana | 18 | 6.78 | 23.58 |
| SUMMER | Maine | 65 | 10.25 | 12.01 |
| SUMMER | Maryland | 129 | 23.44 | 14.76 |
| SUMMER | Massachusetts | 89 | 0.45 | 16.00 |
| SUMMER | Michigan | 143 | 18.38 | 14.31 |
| SUMMER | Minnesota | 81 | 41.76 | 20.27 |
| SUMMER | Mississippi | 10 | 24.13 | 35.22 |
| SUMMER | Missouri | 99 | 15.40 | 24.29 |
| SUMMER | Montana | 21 | 11.29 | 13.28 |
| SUMMER | Nebraska | 17 | 72.19 | 28.08 |
| SUMMER | Nevada | 13 | 20.14 | 24.80 |
| SUMMER | New Hampshire | 48 | 10.51 | 10.71 |
| SUMMER | New Jersey | 75 | 29.32 | 12.43 |
| SUMMER | New Mexico | 20 | 3.62 | 13.75 |
| SUMMER | New York | 148 | 28.06 | 14.17 |
| SUMMER | North Carolina | 220 | 18.82 | 17.10 |
| SUMMER | North Dakota | 18 | 23.09 | 24.93 |
| SUMMER | Ohio | 242 | 15.63 | 15.42 |
| SUMMER | Oklahoma | 30 | 77.10 | 19.27 |
| SUMMER | Oregon | 142 | 17.62 | 16.04 |
| SUMMER | Pennsylvania | 594 | 23.10 | 13.41 |
| SUMMER | Puerto Rico | 1 | 50.00 | 50.00 |
| SUMMER | Rhode Island | 14 | 12.33 | 14.17 |
| SUMMER | South Carolina | 61 | 46.47 | 20.06 |
| SUMMER | South Dakota | 12 | 12.23 | 16.82 |
| SUMMER | Tennessee | 60 | 30.22 | 15.56 |
| SUMMER | Texas | 146 | 24.20 | 13.70 |
| SUMMER | Utah | 184 | 18.83 | 23.55 |
| SUMMER | Vermont | 43 | 17.67 | 18.74 |
| SUMMER | Virginia | 398 | 17.64 | 17.97 |
| SUMMER | Washington | 90 | 16.91 | 16.55 |
| SUMMER | West Virginia | 52 | 14.41 | 15.59 |
| SUMMER | Wisconsin | 102 | 18.23 | 18.31 |
| SUMMER | Wyoming | 18 | 3.83 | 21.15 |
| SUMMER | MultiStateOperation | 126 | 18.57 | 21.76 |