In light of the rise in probiotic supplementation’s popularity among beekeepers, the California State Beekeepers Association (CSBA) awarded Bee Informed Partnership (BIP) funding to test the colony health benefits of probiotic supplementation in commercial beekeeping operations. To do so, we tested two commercially available probiotic products: SuperDFM, manufactured by Strong Microbials, and Mann Lake’s ProDFM.
Field trials were conducted between fall 2019-spring 2020 and included colonies from commercial operations in Oregon and California. For each region, three bee yards were selected, and within each yard, four colonies were randomly assigned to one of three groups: SuperDFM; ProDFM; or No supplementation Negative Control, (2 regions x 3 bee yards x 12 colonies per yard = 72 total colonies). We visited the colonies four times during the course of the study: twice in fall 2019 (visits 1 and 2) and twice in spring 2020 (visits 3 and 4). During visit 1, we set up the colonies, collected baseline colony health information and applied SuperDFM and ProDFM to the appropriate colonies according to label specifications. Two weeks later, we revisited the colonies to record colony health metrics (visit 2). During visit 3 in the Spring of 2020, colony health was assessed and supplementation was reapplied to the appropriate colonies, with follow-up health metrics collected two weeks later (visit 4).
Colony Survival
All 72 colonies survived until the end of the trial. We are therefore unable to determine if probiotic supplementation had any impact on colony survival.
Queen Events
We documented four queen events during the course of this study belonging to the treatment groups Product A (one colony,) Product B (two colonies) and Control (one colony). The number of queen events was insufficient to determine statistical differences between groups.
Varroa Loads
There were significant differences in Varroa load between the two regions. Varroa loads did significantly change over time. However, those changes were inconsistent between California and Oregon colonies. There was no significant difference in Varroa loads between the three experimental groups.
*We documented Varroa loads not because of a claim that the products would impact them, but to ensure high infestations would not blind us to potential beneficial effects of the probiotic supplementation. Of the 72 colonies monitored, two colonies reached 10% infestation at some point during the trial. Analyses were carried out with and without those data points and reached the same conclusions.
Viral Prevalence
There was no significant difference in the rate of viral infection or remission before and after winter between the three groups for seven out of the eight molecular targets: ABPV, BQCV, CBPV, DWV-A (DWV), IAPV, LSV-2, DWV-B (VDV). There was a marginal effect of Product B on the prevalence of SBV infections cleared, but this effect was not confirmed once outlier colonies with high Varroa loads were excluded.
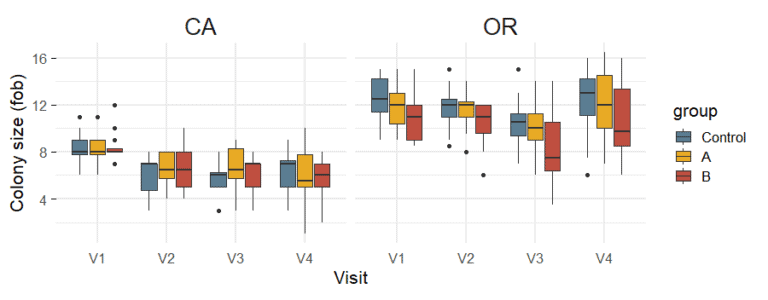
Colony Size (Frames of Bees)
Average colony size did change significantly over time, and this change varied according to region (Figure 1). However, supplementation had no significant effect on colony size.
Brood Pattern (qualitative score from 1 to 5)
There were significant differences in brood pattern change over time between the two geographic regions. However, the supplementation treatment had no significant effect on the quality of brood pattern.
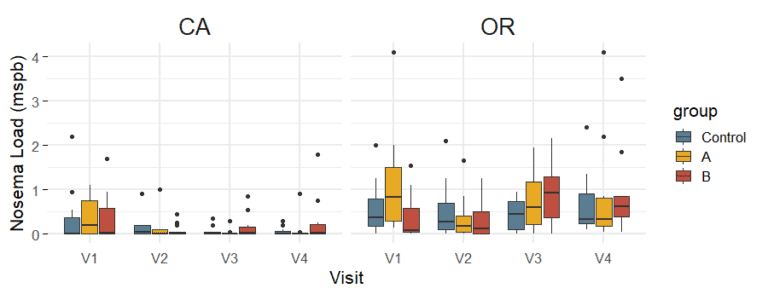
Nosema Loads
Nosema loads were measured as a potential indicator of colony stress. Though the three treatment groups ended the trial without significant differences in their Nosema infestation levels, we did observe a significant drop in Nosema load between Visit 1 and Visit 2 for colonies treated with Probiotic A, which could have resulted from slightly higher starting loads (Figure 2). However, the Probiotic A-treatment group’s change in Nosema load between Visit 1 and Visit 2 were not significantly different from the control colonies, and colonies receiving Probiotic B also showed Nosema load declines during that time. Noticeably, supplemented colonies did not show decreased Nosema loads in the spring compared to the control colonies.
Signs of Disease
Eight of the fifteen disease symptoms routinely documented during colony health inspections were encountered in this trial: chewed down brood (CDB), chalkbrood (chalk), entombed pollen, phoretic Varroa (Varroa found on adult bees), deformed wing virus A (DWV-A), idiopathic brood disease syndrome (IBDS), European foulbrood (EFB) and small hive beetles (SHB; adults). There was no significant difference between treatment groups in the prevalence of any observed disease symptoms.
We did not perform gut microbiome analysis during this study.
Conclusion
Considering the limitations of this study—a limited geographic scope and study duration—we found no significant effect of probiotic supplementation on population size (frames of bees) or standard colony health metrics, including Varroa load, Nosema load, brood pattern, signs of disease, queen events and viral load.
Printable 1-Pager of Study Here